
Page 13 - angeo-21-299-2003
P. 13
R. Sorgente et al.: Seasonal variability in the Central Mediterranean Sea circulation 311
(a)A) (b)F)
39 39
38 38
37 37
North Latitude
North Latitude
36 36
35 35
34 34
33 33
0.2 m/s 0.2 m/s
32 32
9 10 11 12 13 14 15 16 17 9 10 11 12 13 14 15 16 17
East Longitude East Longitude
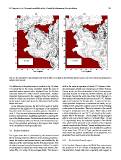
Fig. 13. The simulated 10-day averaged total velocity field at 5 m depth in (a) February and (b) August. One vector every four grid points is
plotted. Units are m/s.
The difference in the performance is evident in Fig. 10 where shift in the mean temperature of about 6 ◦C between Febru-
it is noted that in the coarse resolution model the zone of ary and August, mainly as a consequence of surface heating.
upwelled waters appears rather displaced from the Sicilian During winter, the thermal structure is fairly homogeneous,
coast and limited to a rather narrow coastal band. Another especially beyond 35◦ N (in the Sardinia Channel, the south
important improvement is the capacity of the fine resolution Tyrrhenian Sea and the north side of the Sicily Channel). In
model to reduce the occurrence of high velocities produced these regions the temperature does not exceed 15 ◦C. Warmer
by the coarse model, such as on the Adventure Bank and the waters are found on the African side. In summer the sim-
Malta shelf area. ulated potential temperature is characterized mainly by up-
welling events along the southern coast of Sicily, bringing
In the following sections, the skill of the model is further cooler water to the surface. This is in contrast to the overall
evidenced by the high level of agreement of the simulated increase in temperature over the region. Warm waters, with
flow field with the known circulation patterns described in a mean temperature of over 26 ◦C, are found on the south-
Sect. 2. This is a main achievement of this work when com- eastern side of the domain. The simulated 10-day averaged
pared to other previous modelling experiences covering this salinity and total velocity fields at 5 m depth (Figs. 12 and
part of the Mediterranean. On this basis the model results can 13, respectively) show the seasonal signature of the MAW
be very confidently utilized to furnish a first detailed descrip- flow which can be followed as an extension of the Algerian
tion of the circulation pertaining to this region, with insight coastal current into the Sicilian Channel and beyond as an un-
on its variability in both space and time. stable flux of relative fresh water. It is identified by a salinity
in the range from 37.2 to 37.7 psu, and its horizontal vari-
4.3 Surface circulation ation shows the gradual modification of its properties as it
penetrates from west to east across the domain.
The upper ocean flow is dominated by the eastward bound
MAW moving under the influence of the density gradient be- 4.3.1 The Sardinia Channel region
tween the eastern and western basins, and modified by the
influence of the wind forcing and the bottom geometry. The In the Sardinia Channel region, the MAW flow enters across
simulated seasonal potential temperature fields at 5 m depth the section at 9◦ E as a broad, homogeneous layer whose
are presented by comparison of the winter and summer situ- characteristics change with time, especially with respect to
ations (Fig. 11), using 10-day averaged fields. This shows a