
Page 9 - angeo-21-299-2003
P. 9
R. Sorgente et al.: Seasonal variability in the Central Mediterranean Sea circulation 307
(a) A) (b) B)
14.35 38.522
14.3 38.52
14.25 38.518
14.2 38.516
14.15 38.514
°C
m2/sec2
psu
14.1 38.512
14.05 38.51
14 38.508
13.95 38.506
13.9 38.504
1 2 3 4 5 6 7 8 9 10 11 12 1 2 3 4 5 6 7 8 9 10 11 12
(c)
x 10−3
3.2
3
2.8
2.6
2.4
2.2
2
1.8
1.6
0 2 4 6 8 10 12
Time (month)
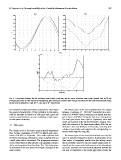
Fig. 9. Comparison between the fine resolution inner model (solid line) and the coarse resolution outer model (dashed line) by 10-day
averaged time series of mean volume (a) temperature, (b) salinity and (c) total kinetic energy, calculated over the inner model domain during
the last year of integration. Units are ◦C, psu and m2/s2, respectively.
tive months for winter and summer, respectively. They depict The annual cycle of the total superficial heat flux ranges
the general characteristics of the circulation in the region, between a minimum of −150 W/m2 (December) to a maxi-
with the prevalent occurrence of sub-basin scale gyres and mum of +130 W/m2 (June), summing to an annual heat bud-
intense coastal boundary currents, exhibiting a high tempo- get of about −0.8 W/m2 during the last year of integration.
ral and spatial variability. The heat gain occurs from April to September, while heat
losses are maximal in the period November–January. Sim-
4.1 Time series ilarly the extremes of the basin mean salinity (Fig. 8a) are
38.5 psu in June and 38.52 psu in December, occurring with
The annual cycle of the basin mean potential temperature a delay of two months with respect to the corresponding ex-
(Fig. 7a) has a minimum of 13.87◦C in March and a max- tremes of the water flux (Fig. 8b).
imum of 14.30◦C in September. The model replicates well
the Med6 climatology, although the range is slightly less and The annual cycle of the mean basin salinity over the five
a small phase shift is introduced. The temperature extremes years of perpetual integration shows a slight positive trend
occur at about three months after the corresponding extremes (two orders of magnitude smaller than the salinity value)
of the total superficial heat flux (Fig. 7b). This delay gives that is probably caused by the low initial salinity field de-
an indication of the time scales for vertical exchanges in the rived from the coarse model with respect to the climatologi-
water column. cal mean. However, the trend tends to attenuate towards the
last year of integration as the model approaches closely the