
Page 7 - angeo-21-299-2003
P. 7
R. Sorgente et al.: Seasonal variability in the Central Mediterranean Sea circulationdyn/cm2 305
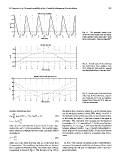
Wind Stress AmplitudeW/m2 Fig. 4. The perpetual annual cycle
0.5 of the east-west (solid line) and north-
0.4mm south (dashdot line) mean ERA wind
0.3 stress components. Units are dyne/cm2.
0.2
0.1 Fig. 5. Annual cycle of the total heat
flux (solid line), solar radiation from
0 ERA (dash-dot line) and the upward
0 0.5 1 1.5 2 2.5 3 3.5 4 4.5 5 heat flux (dashed line). Units are W/m2.
Time (year)
Fig. 6. Annual cycle of the total fresh-
Monthly heat flux water flux (E-P) (solid line), evapora-
200 tion (dash-dot line) and precipitation
100 (dashed line) from the ERA data set.
Units are mm/month.
0
−100
−200
1 2 3 4 5 6 7 8 9 10 11 12
Time (month)
Monthly surface water flux from ERA
100
80
60
40
20
0
1 2 3 4 5 6 7 8 9 10 11 12
Time (month)
monthly climatology, thus: the salinity flux correction, where Sz=0 is the monthly mean
sea climatological surface salinity from Med6, σ (1)H is
∂S (18) the thickness of the surface layer and α is the relaxation time.
KH ∂z |z=η= S(E − P ) + C2(S − S) (19) In this study, the value C2 has been chosen to be equal to
0.7 m/day. The correction term accounts for the imperfect
H knowledge of E − P , especially of P . All the monthly forc-
C2 = σ (1) ing fields (τ , T , S , Qsol, E and P ) are linearly interpolated
α between adjacent months. Qup is linearly interpolated be-
tween adjacent 10-day averaged fields. At the ocean bottom
where S is the model salinity at the first level, E is the evap- the boundary condition is based on a quadratic drag formu-
oration rate, and P is the precipitation. The monthly evapo- lation.
ration values are computed by Korres and Lascaratos (2003)
according to: In Sect. 4 the general circulation in the Central Mediter-
ranean and its seasonal variability are discussed from model
E = Qe (20) output during the last year of integration of the 5-year per-
LE petual simulation.
where Qe is the latent heat flux and LE is the latent heat
of vaporisation. The monthly precipitation data are obtained
from Legates and Wilmott (1990). The annual cycle of these
components is shown in Fig. 6. The last term in Eq. (18) is