
Page 8 - angeo-21-299-2003
P. 8
306 R. Sorgente et al.: Seasonal variability in the Central Mediterranean Sea circulation
A)
14.5 (a)A)
1144..54
1144..43
°C °C 1144..32
1144..21
141.14
131.49
1133..98
0 0.5 1 1.5 2 2.5 3 3.5 4 4.5 5
13.8
0 0.5 1 1.5 2 2.5 3 3.5 4 4.5 5
(b)B)
150 B)
115000
10500
W/m2W/m2 500
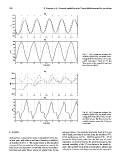
−500 Fig. 7. (a) Comparison between the
−−15000 modelled (solid line) and Med6 clima-
−−110500 tology (dash-dot line) time series of po-
tential temperature; Units are ◦C. (b)
−1500 0.5 1 1.5 2 2.5 3 3.5 4 4.5 5 Time series of the modelled total heat
0 0.5 1 1.5 2 Time2.(5year) 3 3.5 4 4.5 5 flux; Units are W/m2.
Time (year)
A)
38.53 (a)A)
38.53
38.52
38.52
psupsu 38.51
38.51
38.5
38.5
38.49
0 0.5 1 1.5 2 2.5 3 3.5 4 4.5 5
38.49
0 0.5 1 1.5 2 2.5 3 3.5 4 4.5 5
(b)B)
40 B)
4350
3305
mmmm 3250
2205 Fig. 8. (a) Comparison between the
2150 modelled (solid line) and Med6 clima-
1150 tology (dotted line) time series of salin-
105 0.5 1 1.5 2 2.5 3 3.5 4 4.5 ity; Units are psu. (b) Time series of the
0 5 modelled surface water flux. Units are
5
0 0.5 1 1.5 2 Time2.(5year) 3 3.5 4 4.5 5 mm/month.
Time (year)
4 Results averaged values. The simulated horizontal fields at 5 m and
280 m depth, and vertical sections along the meridians 9◦ E,
Starting from 1 January, the model is integrated for five suc- 13◦ E and between 11.1◦ E – 36.85◦ N and 12.3◦ E – 38◦ N
cessive years with surface and lateral boundary conditions,
as described in Sect. 3. The model output is first described (across the Sicily Strait), taken from the fifth year of model
in terms of the time evolution of key parameters, namely the
basin mean of temperature and salinity, and the mean super- integration, are used to describe the phenomenology and the
ficial heat and water fluxes, which are plotted from 10-day
seasonal variability of the 3-D circulation in the model do-
main. The monthly mean fields of temperature, salinity and
velocity for February and August are used as the representa-