
Page 11 - angeo-21-299-2003
P. 11
R. Sorgente et al.: Seasonal variability in the Central Mediterranean Sea circulation 309
(e)E)
(f) B)
39 39
38 38
37 37
North Latitude
North Latitude
36 36
35 35
34 34
33 33
0.2 m/s
32
0.2 m/s 32
9 10 11 12 13 14 15 16 17 9 10 11 12 13 14 15 16 17
East Longitude East Longitude
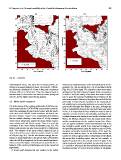
Fig. 10. ... continued.
climatological values. The water flux is always positive, re- made by the comparison plots of the horizontal fields of tem-
sulting in an annual budget of about +20.8 mm/yr. It fluctu- perature (Fig. 10a, b), salinity (Fig. 10c, d) and total velocity
ates between a minimum of +5 mm in May and a maximum (Fig. 10e, f) at 30 m depth. The example is taken from values
of about +40 mm in November. Thus, the seasonal cycle is averaged over the first 10 days of August. Such a comparison
characterized by values below the mean in winter, spring and is useful to verify the ability of the inner fine model to repli-
summer, and by higher values during autumn. cate in space the principal hydrodynamical features of the
outer coarse model. Moreover, they show the merit of the fine
4.2 Model-model comparison grid model in improving the resolution of the mesoscale de-
tail, amplifying or attenuating particular structures that char-
The performance of the coupling between the POM fine reso- acterize the simulated flow details in the area. Although the
lution model and the OGCM-MOM coarse model can be ob- level of compatibility between the two model solutions varies
tained by comparing the inner model output with the bench- in time, it is evident that the high resolution model is able to
mark basin scale OGCM model simulation calculated over reproduce well the AIS flow and variability, including the as-
the inner domain. Figure 9 is a comparative plot between sociated characteristic structures such as the Adventure Bank
the two models showing a time series of 10-day averaged Vortex, the Maltese Channel Crest, the Ionian Bank Vortex
values of key parameters, namely the mean volume temper- and the overshooting into the northern Ionian Sea. More-
ature, salinity and total kinetic energy. There is a very high over, the sigma-coordinate vertical discretisation used in the
correlation in the mean volume temperature (Fig. 9a). The fine resolution model results in an improved simulation of
minima and maxima are very close, except for a slight phase the upwelling phenomena along the southern coast of Sicily,
shift. The variation of the mean volume salinity in time is and gives a generally improved description of the water dy-
close to that of the coarse resolution model, except for a shift namics in the shallow areas. In the POM inner model the
of 0.01 psu (Fig. 9b). For the total kinetic energy, the cor- number of vertical sigma levels is independent of the depth;
relation is lower especially in the period April to November, this means that in shallow water, such as, for example, at
when the AIS flow magnitude in the inner model implemen- depths of less than 35 m, the vertical column of water in the
tation is somewhat higher. This assessment quantifies the ro- coarse resolution model is simulated by only three levels, at
bustness of the nested-grid technique used in the numerical 5, 15 and 30 m, whereas in the fine resolution model the same
experiment. maximum number of vertical levels is utilized at all depths.
A visual match between the two models can be further