
Page 6 - hydro-maritime_2010
P. 6
3.5
3.0
2.5
2.0
1.5
1.0
0.5
m
Fig. 2. SWAN outputs: arrows indicating the waves propagation direction over imposed to the significance waves height
[m] shown by a colour scale.
4.4 Maximum run-up and tide effects assessment
The average slope of the foreshore beach is tan βf = 0.0359 (Figure 3), and assuming Horms = 1.27 m (≡ 0.706 H s),
maximum wave run-up is estimated to be about 7.73 m. As reported in the literature, the used equation gives a run-up
greater than the actual value; therefore the authors are currently implementing a more complex model to estimate the
run-up more accurately.
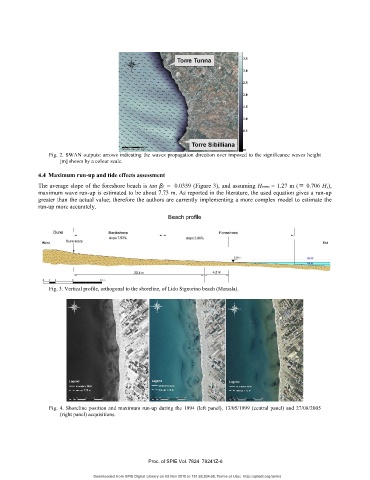
Fig. 3. Vertical profile, orthogonal to the shoreline, of Lido Signorino beach (Marsala).
Fig. 4. Shoreline position and maximum run-up during the 1994 (left panel), 13/05/1999 (central panel) and 27/08/2005
(right panel) acquisitions.
Proc. of SPIE Vol. 7824 78241Z-6
Downloaded from SPIE Digital Library on 05 Nov 2010 to 151.82.204.68. Terms of Use: http://spiedl.org/terms