
Page 2 - Sustainable_Energy_2018
P. 2
M. Majidi Nezhad et al. Sustainable Energy Technologies and Assessments 30 (2018) 68–76
Nomenclature α P temperature coefficient of power [%/°C]
PV cell temperature in the time step [°C]
T c
WEC Wave Energy Converter T cSTC, PV cell temperature under standard condition [°C]
PV Photovoltaic H m significant weight height [m]
G f diesel generators hourly fuel consumption [l/h] T p peak wave energy period [s]
diesel generator power output [kW] significant wave energy period [s]
P 0 T e
P n diesel generator nominal power HS Hot Spot
X diesel generator fuel curve slope [l/kWh] C f capacity factor [%]
Y diesel generator fuel curve intercept coefficient [l/kWh] R f rated capacity factor [%]
PV power output [kW] WEC annual energy production [MWh/y]
P PV AEP WEC
P PVp PV system peak power [kW] Fr Froude number
f PV derating factor [%] λ geometric scale factor between the prototype and the
PV
G T solar radiation incident on the PV array in the current time model
step P proto rated power of the prototype [kW]
G TSTC, solar radiation incident on the PV array under standard P model rated power of the model [kW]
condition
[21], the Beibu Gulf in China [13], the Caspian Sea and the Persian Gulf baseline scenario (represented by the current energy supply system) in
on Iranian coastlines [22–24]. order to analyse the benefits introduced by an energy storage system.
As regard the Mediterranean sea many studies have been under- The same order has been followed in this paragraph to describe the
taken [25–29], the wave energy resource contribution in Spain, France, research methodology.
Italy and Greece is totally estimated as 30 GWh [30]. In particular, Italy
has a geographical position that allows the exploitation of different
Site description and load estimation
sources of renewable energy, including waves, mainly due to the sig-
nificant length of the Italian coastline [30]. Currently Italy still imports
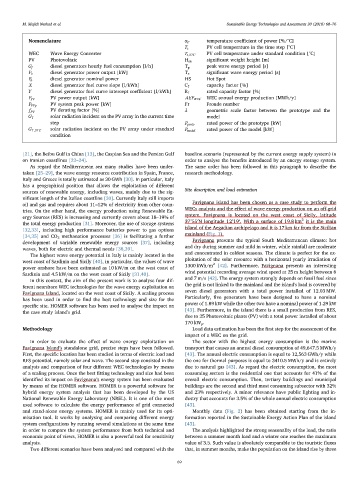
Favignana island has been chosen as a case study to perform the
oil and gas and requires about 11–12% of electricity from other coun-
tries. On the other hand, the energy production using Renewable En- WECs analysis and the effect of wave energy production on an off-grid
system. Favignana is located on the west coast of Sicily, latitude
ergy Sources (RES) is increasing and currently covers about 18–19% of
2
37°55′N longitude 12°19′. With a surface of 19.8 km it is the main
the total energy production [31]. Moreover, the use of storage systems
island of the Aegadian archipelago and it is 17 km far from the Sicilian
[32,33], including high performance batteries power to gas options
mainland (Fig. 1).
[34,35] and CO 2 methanation processes [36] is facilitating a further
Favignana presents the typical South Mediterranean climate: hot
development of variable renewable energy sources [37], including
waves, both for electric and thermal needs [38,39]. and dry during summer and mild in winter, while rainfall are moderate
and concentrated in coldest seasons. The climate is perfect for the ex-
The highest wave energy potential in Italy is mainly located in the
west coast of Sardinia and Sicily [40], in particular, the values of wave ploitation of the solar resource with a horizontal yearly irradiation of
2
1300 kWh/m [42]. Furthermore, Favignana presents an interesting
power onshore have been estimated as 10 kW/m on the west coast of
wind potential recording average wind speed at 25 m height between 6
Sardinia and 4.5 kW/m on the west coast of Sicily [31,40].
In this context, the aim of the present work is to analyse four dif- and 7 m/s [42]. The energy system strongly depends on fossil fuel since
the grid is not linked to the mainland and the island's load is covered by
ferent nearshore WEC technologies for the wave energy exploitation on
Favignana Island, located on the west coast of Sicily. A scaling process seven diesel generators with a total power installed of 12.03 MW.
Particularly, five generators have been designed to have a nominal
has been used in order to find the best technology and size for the
power of 1.89 kW while the other two have a nominal power of 1.29 kW
specific site. HOMER software has been used to analyse the impact on
[43]. Furthermore, in the island there is a small production from RES,
the case study island's grid.
due to 25 Photovoltaic plants (PV) with a total power installed of about
170 kW p .
Methodology Load data estimation has been the first step for the assessment of the
impact of a WEC on the grid.
In order to evaluate the effect of wave energy exploitation on The sector with the highest energy consumption is the marine
Favignana Island’s standalone grid, precise steps have been followed. transport that causes an annual diesel consumption of 49,647.5 MWh/y
First, the specific location has been studied in terms of electric load and [43]. The annual electric consumption is equal to 12,563 GWh/y while
RES potential, namely solar and wave. The second step consisted in the the one for thermal purposes is equal to 3410.5 MWh/y and is entirely
analysis and comparison of four different WEC technologies by means due to natural gas [43]. As regard the electric consumption, the most
of a scaling process. Once the best fitting technology and size had been consuming sectors is the residential one that accounts for 41% of the
identified its impact on Favignana’s energy system has been evaluated overall electric consumption. Then, tertiary buildings and municipal
by means of the HOMER software. HOMER is a powerful software for buildings are the second and third most consuming subsector with 32%
hybrid energy system analysis that has been developed by the US and 23% respectively. A minor relevance have public lighting and in-
National Renewable Energy Laboratory (NREL). It is one of the most dustry that accounts for 3.5% of the whole annual electric consumption
used software to calculate the energy performance of grid connected [43].
and stand-alone energy systems. HOMER is mainly used for its opti- Monthly data (Fig. 2) has been obtained starting from the in-
misation tool. It works by analysing and comparing different energy formation reported in the Sustainable Energy Action Plan of the island
system configurations by running several simulations at the same time [43].
in order to compare the system performance from both technical and The analysis highlighted the strong seasonality of the load, the ratio
economic point of views, HOMER is also a powerful tool for sensitivity between a summer month load and a winter one reaches the maximum
analysis. value of 3.5. Such value is absolutely comparable to the touristic fluxes
Two different scenarios have been analysed and compared with the that, in summer months, make the population on the island rise by three
69