
Page 7 - Sustainable_Energy_2018
P. 7
M. Majidi Nezhad et al. Sustainable Energy Technologies and Assessments 30 (2018) 68–76
Table 3 both cases, which leads to a CO 2 emissions reduction equal to 12%
Wave Dragon 500 kW effect on Favignana's grid, simulation results. without battery and 13.45% with a storage system. Furthermore, a high
renewable fraction is registered, the integration of the Wave Dragon
Quantity Value Unit
increases its value to 13.1%. The introduction of the battery storage
Energy produced 14,288.7 MWh/y further increases it of 1.2 percentage points reaching the value of 14.3%
Excess electricity 360.9 MWh/y
strongly reducing the excess electricity to a value of 1.1%.
Excess electricity 2.5 %
Renewable fraction 13.1 % In light of such results, a brief sensitivity analysis has been per-
PV produced energy 264.2 MWh/y formed in order to analyse the impact of the wave energy potential on
PV penetration 1.9 % the system performance. In particular, the sensitivity analysis studied
WEC produced energy 1934.5 MWh/y the system functioning in the case of the years with the minimum and
WEC penetration 13.9 % the maximum energy flux between the 14 years long dataset analysed in
Diesel consumed 3,192,872 l/y
Carbon dioxide emission 8372.4 tonCO 2 /y this paper. As mentioned in paragraph 2.3.2, the minimum recorded
energy flux is relative to year 2006 and it is equal to 5.53 kW/m while
the most energetic year is 2010 with a recorded average energy flux of
9.19 kW/m. Fig. 6 depicts the variation of the energy produced by the
Table 4 WEC and the renewable penetration in the energy system (6a), and the
Wave Dragon 500 kW-battery storage system’seffect on Favignana's grid, si- yearly CO 2 emissions and fuel consumption (6b) in the three different
mulation results. reference years.
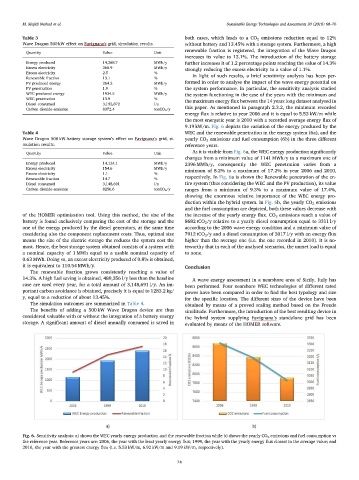
As it is visible from Fig. 6a, the WEC energy production significantly
Quantity Value Unit
changes from a minimum value of 1141 MWh/y to a maximum one of
Energy produced 14,124.1 MWh/y 2396 MWh/y, consequently the WEC penetration varies from a
Excess electricity 154.6 MWh/y minimum of 8.2% to a maximum of 17.2% in year 2006 and 2010,
Excess electricity 1.1 %
Renewable fraction 14.7 % respectively. In Fig. 6a is shown the Renewable penetration of the en-
Diesel consumed 3,148,691 l/y tire system (thus considering the WEC and the PV production), its value
Carbon dioxide emission 8256.6 tonCO 2 /y ranges from a minimum of 9.3% to a maximum value of 17.4%,
showing the enormous relative importance of the WEC energy pro-
duction within the hybrid system. In Fig. 6b, the yearly CO 2 emissions
and the fuel consumption are depicted, both these values decrease with
of the HOMER optimisation tool. Using this method, the size of the the increase of the yearly energy flux. CO 2 emissions reach a value of
battery is found exclusively comparing the cost of the storage and the 8682 tCO 2 /y relative to a yearly diesel consumption equal to 3311 l/y
one of the energy produced by the diesel generators, at the same time according to the 2006 wave energy condition and a minimum value of
considering also the component replacement costs. Thus, optimal size 7912 tCO 2 /y and a diesel consumption of 3017 l/y with an energy flux
means the size of the electric storage the reduces the system cost the higher than the average one (i.e. the one recorded in 2010). It is no-
most. Hence, the best storage system obtained consists of a system with teworthy that in each of the analysed scenarios, the unmet load is equal
a nominal capacity of 1 MWh equal to a usable nominal capacity of to none.
0.63 MWh. Doing so, an excess electricity produced of 0.8% is obtained,
it is equivalent to 110.54 MWh/y. Conclusion
The renewable fraction grows consistently reaching a value of
14.3%. A high fuel saving is obtained, 489,356 l/y less than the baseline A wave energy assessment in a nearshore area of Sicily, Italy has
case are used every year, for a total amount of 3,148,691 l/y. An im- been performed. Four nearshore WEC technologies of different rated
portant carbon avoidance is obtained, precisely it is equal to 1283.2 kg/ power have been compared in order to find the best typology and size
y, equal to a reduction of about 13.45%. for the specific location. The different sizes of the device have been
The simulation outcomes are summarized in Table 4. obtained by means of a proved scaling method based on the Froude
The benefits of adding a 500 kW Wave Dragon device are thus similitude. Furthermore, the introduction of the best resulting device in
considered valuable with or without the integration of a battery energy the hybrid system supplying Favignana’s standalone grid has been
storage. A significant amount of diesel annually consumed is saved in evaluated by means of the HOMER software.
Fig. 6. Sensitivity analysis: a) shows the WEC yearly energy production and the renewable fraction while b) shows the yearly CO 2 emissions and fuel consumption vs
the reference year. Reference years are: 2006, the year with the least yearly energy flux; 1999, the year with the yearly energy flux closest to the average value; and
2010, the year with the greatest energy flux (i.e. 5.53 kW/m, 6.92 kW/m and 9.19 kW/m, respectively).
74