
Page 4 - Sustainable_Energy_2018
P. 4
M. Majidi Nezhad et al. Sustainable Energy Technologies and Assessments 30 (2018) 68–76
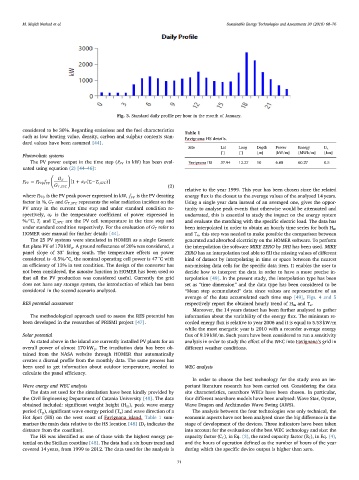
Fig. 3. Standard daily profile per hour in the month of January.
considered to be 30%. Regarding emissions and the fuel characteristics
Table 1
such as low heating value, density, carbon and sulphur contents stan-
Favignana HS details.
dard values have been assumed [44].
Site Lat Long Depth Power Energy D c
[°] [°] [m] [kW/m] [MWh/m] [km]
Photovoltaic systems
The PV power output in the time step (P PV in kW) has been eval- Favignana HS 37.94 12.27 10 6.88 60.27 0.5
uated using equation (2) [44–46]:
f
P
P PV = P PVp PV ⎛ ⎜ G T ⎞ ⎟[1 + αT( c −T c STC, )]
⎝ G TSTC, ⎠ (2)
relative to the year 1999. This year has been chosen since the related
where P PVp is the PV peak power expressed in kW, f PV is the PV derating energy flux is the closest to the average values of the analysed 14 years.
represents the solar radiation incident on the
factor in %, G T and G TSTC, Using a single year data instead of an averaged one, gives the oppor-
PV array in the current time step and under standard condition re- tunity to analyse peak events that otherwise would be attenuated and
spectively, α P is the temperature coefficient of power expressed in underrated, this is essential to study the impact on the energy system
%/°C, T c and T cSTC, are the PV cell temperature in the time step and and evaluate the matching with the specific electric load. The data has
under standard condition respectively. For the evaluation of G T refer to been interpolated in order to obtain an hourly time series for both H m
HOMER user manual for further details [44]. and T e , this step was needed to make possible the comparison between
The 25 PV systems were simulated in HOMER as a single Generic generated and absorbed electricity on the HOMER software. To perform
flat plate PV of 170 kW p . A ground reflectance of 20% was considered, a the interpolation the software MIKE ZERO by DHI has been used. MIKE
panel slope of 33° facing south. The temperature effects on power ZERO has an interpolation tool able to fill the missing values of different
considered is -0.5%/°C, the nominal operating cell power is 47 °C with kind of dataset by interpolating in time or space between the nearest
an efficiency of 13% in test condition. The design of the converter has non-missing data cells for the specific data item. It enables the user to
not been considered, the autosize function in HOMER has been used so decide how to interpret the data in order to have a more precise in-
that all the PV production was considered useful. Currently the grid terpolation [49]. In the present study, the interpolation type has been
does not have any storage system, the introduction of which has been set as “time dimension” and the data type has been considered to be
considered in the second scenario analysed. “Mean step accumulated” data since values are representative of an
average of the data accumulated each time step [49], Figs. 4 and 5
RES potential assessment respectively report the obtained hourly trend of H m and T e .
Moreover, the 14 years dataset has been further analysed to gather
The methodological approach used to assess the RES potential has information about the variability of the energy flux. The minimum re-
been developed in the researches of PRISMI project [47]. corded energy flux is relative to year 2006 and it is equal to 5.53 kW/m
while the most energetic year is 2010 with a recorder average energy
Solar potential flux of 9.19 kW/m. Such years have been considered to run a sensitivity
As stated above in the island are currently installed PV plants for an analysis in order to study the effect of the WEC into Favignana’s grid in
overall power of almost 170 kW p . The irradiation data has been ob- different weather conditions.
tained from the NASA website through HOMER that automatically
creates a diurnal profile from the monthly data. The same process has
been used to get information about outdoor temperature, needed to WEC analysis
calculate the panel efficiency.
In order to choose the best technology for the study area an im-
Wave energy and WEC analysis portant literature research has been carried out. Considering the data
The data set used for the simulation have been kindly provided by site characteristics, nearshore WECs have been chosen. In particular,
the Civil Engineering Department of Catania University [48]. The data four different nearshore models have been analysed: Wave Star, Oyster,
obtained included: significant weight height (H m ), peak wave energy Wave Dragon and Archimedes Wave Swing (AWS).
period (T p ), significant wave energy period (T e ) and wave direction of a The analysis between the four technologies was only technical, the
Hot Spot (HS) on the west coast of Favignana island. Table 1 sum- economic aspects have not been analysed since the big difference in the
marises the main data relative to the HS location [48] (D c indicates the stage of development of the devices. Three indicators have been taken
distance from the coastline). into account for the evaluation of the best WEC technology and size: the
The HS was identified as one of those with the highest energy po- capacity factor (C f ), in Eq. (3), the rated capacity factor (R f ), in Eq. (4),
tential on the Sicilian coastline [48]. The data had a six hours trend and and the hours of operation defined as the number of hours of the year
covered 14 years, from 1999 to 2012. The data used for the analysis is during which the specific device output is higher than zero.
71