
Page 3 - Sustainable_Energy_2018
P. 3
M. Majidi Nezhad et al. Sustainable Energy Technologies and Assessments 30 (2018) 68–76
Fig. 1. Favignana Island in Aegadian Archipelago on west coast of Sicily [41].
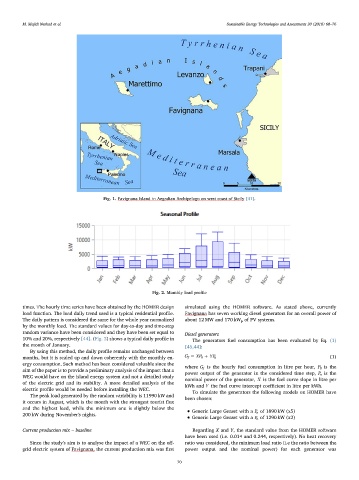
Fig. 2. Monthly load profile
times. The hourly time series have been obtained by the HOMER design simulated using the HOMER software. As stated above, currently
load function. The load daily trend used is a typical residential profile. Favignana has seven working diesel generators for an overall power of
The daily pattern is considered the same for the whole year normalized about 12 MW and 170 kW p of PV systems.
by the monthly load. The standard values for day-to-day and time-step
random variance have been considered and they have been set equal to Diesel generators
10% and 20%, respectively [44].(Fig. 3) shows a typical daily profile in The generators fuel consumption has been evaluated by Eq. (1)
the month of January. [45,44]:
By using this method, the daily profile remains unchanged between
months, but it is scaled up and down coherently with the monthly en- G f = XP 0 + YP n (1)
ergy consumption. Such method has been considered valuable since the
where G f is the hourly fuel consumption in litre per hour, P 0 is the
aim of the paper is to provide a preliminary analysis of the impact that a power output of the generator in the considered time step, P n is the
WEC would have on the island energy system and not a detailed study
nominal power of the generator, X is the fuel curve slope in litre per
of the electric grid and its stability. A more detailed analysis of the
kWh and Y the fuel curve intercept coefficient in litre per kWh.
electric profile would be needed before installing the WEC.
To simulate the generators the following models on HOMER have
The peak load generated by the random variability is 11990 kW and
been chosen:
it occurs in August, which is the month with the strongest tourist flux
and the highest load, while the minimum one is slightly below the • Generic Large Genset with a P n of 1890 kW (x5)
200 kW during November's nights.
• Generic Large Genset with a P n of 1290 kW (x2)
Current production mix – baseline Regarding X and Y, the standard value from the HOMER software
have been used (i.e. 0.014 and 0.244, respectively). No heat recovery
Since the study's aim is to analyse the impact of a WEC on the off- ratio was considered, the minimum load ratio (i.e the ratio between the
grid electric system of Favignana, the current production mix was first power output and the nominal power) for each generator was
70