
Page 5 - Sustainable_Energy_2018
P. 5
M. Majidi Nezhad et al. Sustainable Energy Technologies and Assessments 30 (2018) 68–76
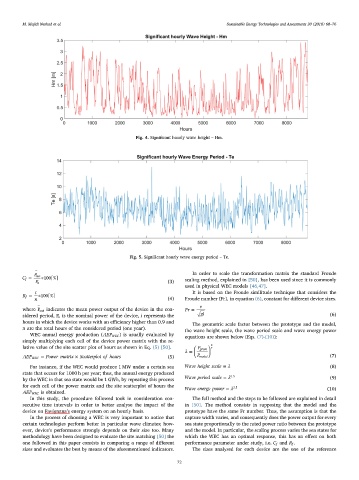
Fig. 4. Significant hourly wave height – Hm.
Fig. 5. Significant hourly wave energy period – Te.
−
In order to scale the transformation matrix the standard Froude
P out
C f = ∗100[%] scaling method, explained in [50], has been used since it is commonly
P n (3)
used in physical WEC models [46,47].
i It is based on the Froude similitude technique that considers the
= ∗100[%]
R f
n (4) Froude number (Fr), in equation (6), constant for different device sizes.
− v
where P out indicates the mean power output of the device in the con- Fr =
gl
sidered period, P n is the nominal power of the device, i represents the (6)
hours in which the device works with an efficiency higher than 0.9 and The geometric scale factor between the prototype and the model,
n are the total hours of the considered period (one year).
the wave height scale, the wave period scale and wave energy power
WEC annual energy production (AEP WEC ) is usually evaluated by
equations are shown below (Eqs. (7)-(10)):
simply multiplying each cell of the device power matrix with the re-
2
lative value of the site scatter plot of hours as shown in Eq. (5) [50]. P proto 7
λ = ⎜ ⎛ ⎟ ⎞
P
AEP WEC = Power matrix × Scatterplot of hours (5) ⎝ model ⎠ (7)
For instance, if the WEC would produce 1 MW under a certain sea Wave height scale = λ (8)
state that occurs for 1000 h per year; thus, the annual energy produced
Wave period scale = λ 0.5 (9)
by the WEC in that sea state would be 1 GWh, by repeating this process
for each cell of the power matrix and the site scatterplot of hours the
Wave energy power = λ 3.5 (10)
AEP WEC is obtained.
In this study, the procedure followed took in consideration con- The full method and the steps to be followed are explained in detail
secutive time intervals in order to better analyse the impact of the in [50]. The method consists in supposing that the model and the
device on Favignana’s energy system on an hourly basis. prototype have the same Fr number. Thus, the assumption is that the
In the process of choosing a WEC is very important to notice that capture width varies, and consequently does the power output for every
certain technologies perform better in particular wave climates; how- sea state proportionally to the rated power ratio between the prototype
ever, device’s performance strongly depends on their size too. Many and the model. In particular, the scaling process varies the sea states for
methodology have been designed to evaluate the site matching [50] the which the WEC has an optimal response, this has an effect on both
one followed in this paper consists in comparing a range of different performance parameter under study, i.e. C f and R f .
sizes and evaluates the best by means of the aforementioned indicators. The sizes analysed for each device are the one of the reference
72