
Page 5 - EAI-4_2015_12_19
P. 5
To characterize and map the seafloor, an important The remote sensing data were also integrated into the
contribution has been provided by remote sensing data GE.RI.N geo-database to be processed and compared
collected by the Ministry of Environment during the with other information layers, in order to support the
MAMPIRA project (Monitoring of Marine Protected Areas interpretation of the geological and geomorphologic
Affected by Environmental Offences). A description of elements derived from the DEM. During the MIVIS survey,
the dataset acquired through aerial surveys on May- a spectral radiometric in situ survey was made at ground
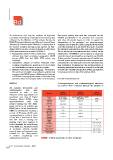
August 2012 is reported below; technical specifications for calibration and validation of the data collected by plane.
of the main sensors are reported in Table 1. The in situ spectral measurements were carried out (in
1. Topographic dataset of the coastal strip – products collaboration with ENEA) in several stations on sandy and
mixed (rocky and sandy) seafloor,at a depth of over 20m [8].
derived from high resolution topographic LiDAR At that point, the P. oceanica meadow was still visible from
survey (DSM first, last DSM, DTM, points xyz, the boat. In each station, samples of surface sediment were
intensity). collected with a Van Veen grab. Grain size distribution was
2. Bathymetric dataset of Marine Protected Area– then determined by gravimetric dry sieving methods. A
merging of bathymetric LiDAR up to 40 m of depth watchdog control unit was installed at about 10 m of height
and and Multibeam survey at greater depths. to monitor the intensity and direction of wind, precipitation,
3. Multispectral Dataset of Egadi Islands - 102 bands in temperature between July 2012 and July 2013.
the spectrum of visible, near infrared, and thermal
acquired with MIVIS sensor (Multispectral Infrared Results and discussion
and Visible Imaging Spectrometer) radiometrically,
geometrically and atmospherically corrected [8; 9].
Method Geomorphological and sedimentological structures
on seafloor were examined through the analysis of
All available information and
environmental data were TABLE 1 Technical characteristics of remote sensing data
organized to make a geo-
database easily upgradable and
integrated over time. A Digital
Elevation Model (DEM) using
topo-bathymetric data was
realised linking the two Multi-
Beam (40-70 m of depths) and
LIDAR (up to -40 m) datasets. The
DEM was obtained by creating a
mosaic of 65 plates (0.04°, each
corresponding to a side of about
4 km), with a total area of about
665 km2. Then, a shading and
lighting relief were applied to
better highlight the morphology
of the DEM area. Finally, for spots
of particular interest, specific
maps of slope and exposure were
created for the interpretation
of seafloor morphology and
sedimentary structures.
14 EAI Energia, Ambiente e Innovazione 4/2015