
Page 4 - Gueguen_alii_2002
P. 4
80 E. GUEGUEN ET ALII
1 30 32.5 30 25
2 30 22.5 25
3 50 35
4 15 40
10
20
40° 5 45
6 25 17.5
7 20
15
8
20 17.5
20 22.5
25
9
10
40
35
30
25
30
20
35°
20°
10°E 15°E 20
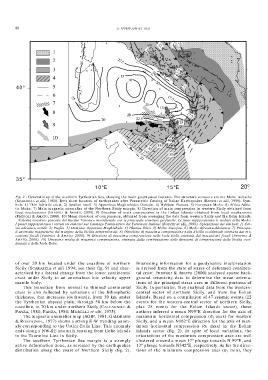
Fig. 2 - General map of the southern Tyrrhenian Sea, showing the main geophysical features. The structure contours are the Moho isobaths
(SCARASCIA et alii, 1984). Dots show location of earthquakes after Parametric Catalog of Italian Earthquakes (BOSCHI et alii, 1999). Sym-
bols: 1) Thin Adriatic crust. 2) Apulian swell. 3) Appenines-Maghrebides Domain. 4) Hyblean Plateau. 5) European Moho. 6) Africa-Adria-
tic Moho. 7) Main magnetic anomalies of the Northern Sicily margin. 8) Direction of main compression in western Sicily obtained from
focal mechanisms (FREPOLI & AMATO, 2000). 9) Direction of main compression in the Eolian Islands obtained from focal mechanisms
(FREPOLI & AMATO, 2000). 10) Mean direction of compression, obtained from averaging the data from western Sicily and the Eolie Islands.
– Schema tettonico generale del Bacino Tirrenico meridionale con le principale strutture geofisiche. Le linee rappresentano le isobate della Moho.
I punti rappresentano i terremoti elencati nel Catalago Parametrico dei Terremoti Italiani (BOSCHI et alii, 1999). Spiegazione dei simboli: 1) Cro-
sta adriatica sottile. 2) Puglia. 3) Dominio Appenino-Maghrebide. 4) Plateau Ibleo. 5) Moho Europea. 6) Moho Africana-Adriatica. 7) Principa-
li anomalie magnetiche del margine della Sicilia settentrionale. 8) Direzione di massima compressione nella Sicilia occidentale ottenuta dai me-
canismi focali (FREPOLI & AMATO, 2000). 9) Direzione di massima compressione nelle Isole Eolie ottenuta dai mecanismi focali (FREPOLI &
AMATO, 2000). 10) Direzione media di massima compressione, ottenuta dalla combinazione delle direzioni di compressione della Sicilia occi-
dentale e delle Isole Eolie.
of over 20 km located under the coastline of northern Interesting information for a geodynamic interpretation
Sicily (SCARASCIA et alii 1994; see their fig. 9) and char- is derived from the state of stress of deformed continen-
acterised by a lateral change from the lower continental tal crust. FREPOLI & AMATO (2000) analysed sparse back-
crust under Sicily to an anomalous low velocity upper ground seismicity data to determine the mean orienta-
mantle body. tions of the principal stress axes in different portions of
This transition from normal to thinned continental Sicily. In particular, they analysed data from the western-
crust is also reflected by variations of the lithospheric central sector of northern Sicily, and from the Eolian
thickness, that increases southwards, from 30 km under Islands. Based on a compilation of 47 seismic events (22
the Tyrrhenian abyssal plain, through 50 km below the events for the western-central sector of northern Sicily,
coastline, to 70 km under northern Sicily (CALCAGNILE & plus 25 events for the Eolian Islands sector), these
PANZA, 1981; PANZA, 1984; MORELLI et alii, 1975). authors inferred a mean N99°E direction for the axis of
The magnetic anomalies map (AGIP, 1981; GALDEANO maximum horizontal compression (σ 1 max) for western
& ROSSIGNOL, 1977) shows a strong E-W trending anom- Sicily, and a mean N162°E direction for the axis of max-
aly corresponding to the Ustica-Eolie Line. This anomaly imum horizontal compression (σ 1 max) in the Eolian
ends along a NW-SE anomaly running from Eolie islands Islands sector (fig. 2). In spite of local variations, the
to the Taormina Line in Sicily. orientations of the maximum compression axes are well
The southern Tyrrhenian Sea margin is a strongly clustered around a mean 17° plunge towards N 99°E, and
active deformation zone, as revealed by the earthquakes 13° plunge towards N342°E, respectively. As for the direc-
distribution along the coast of Northern Sicily (fig. 2). tions of the minimum compression axes (σ 3 min), they