
Page 11 - RFP_2013_Cilona
P. 11
bands, zones of bands, faults and host rock. To each using the finite differences method. The tested volume
one of the aforementioned categories we assigned a is constituted by a first portion (West side) where high-
hydraulic conductivity taken from the available hierarchy structures (i.e. faults and zones of bands) are
literature on porous sandstones (e.g. Antonellini & more diffuse and a second one (East side) where those
Aydin, 1995) based on preliminary analyses carried out structures are more rare. The distribution of single
on deformation bands in grainstones (Tondi, 2007; Rath compactive shear bands is constant in both portions of
et al., 2011) showing that these structures have a the model.
sealing potential comparable to the deformation bands
in sandstones. The two fluid flow tests we performed have been
designed to investigate the effect of the fault system on
The fluid flow simulations have been run in steady a NE-oriented flow (Fig. 10) and the one on a radial
state conditions using the USGS software MODFLOW flow (Fig. 11).
2005. This software solves flow and transport equations
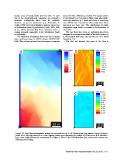
The first test showed that most of the flow is
Figure 10: Fluid flow simulations within the volumes of Fig. 9. a) Steady state simulation: lower left head
point 10 m, top right head 2 m; color legend values are expressed in meters. b) Flow in the N-S direction
(yy), color scale values are expressed in m3/day. c) Flow in the E-W direction (xx), color scale values are
expressed in m3/day.
Stanford Rock Fracture Project Vol. 24, 2013 E-11