
Page 10 - RFP_2013_Cilona
P. 10
part of the model, moreover the flow line directing ploy to obtain a sensible distribution of relative porosity
toward the top right side of the model abruptly deviates. within the investigated volumes.
Discussions and Conclusions Two volumes of different sizes have been used for
the calculation. The first one was as big as the outcrop
In this contribution we proposed a novel workflow and allowed us to gain a general idea of the porosity
useful to model the influence of sub-seismic scale anisotropy within the area, the second one was a
features on fluid flow within porous carbonate fraction of the outcrop size. The model obtained using
reservoirs. For this modeling exercise we integrated the second volume conceptually reproduced the
available literature data describing the dimensional architecture of faults and zones of compactive shear
parameters of a strike-slip fault system crosscutting bands (Fig. 8 b).
Lower-Pleistocene porous carbonates (Tondi et al.,
2012). The dimensional parameters of the fault system As expected the results we obtained were not as
have been implemented into the commercial software accurate as those achieved in previous studies where a
package MOVETM to generate a DFN model. Even if digitized structural map was used as input for the
the DFN stochastic approach has been designed to model. However, the workflow we implemented (Fig.
model open fractures within tight rocks, we found a 7) allows to obtain sensible results and quickly
extrapolating outcrop data to much larger scales.
The porosity distribution calculate with MOVETM
has been used as a tag to indentify compactive shear
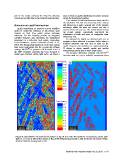
Figure 9: Geo-cellular volumes (same portion of figure 8 b) with real hydraulic conductivity values (cell
size 0.5 x 0.5 m). a) Shows the values of Kxx (E-W direction) expressed in m/d. b) Shows the values of Kzz
(vertical direction) expressed in m/d.
Stanford Rock Fracture Project Vol. 24, 2013 E-10