
Page 5 - RFP_2013_Cilona
P. 5
1994; Taylor & Pollard, 2000; Jourde et al., 2002; photograph by means of image analysis. Based on
Sternlof et al., 2006; Ahmadov et al., 2007; Zhou et al., Tondi et al. (2012), the kinematics of the faults has
2012). Although different methods have been used to been determined based on their orientation: N-S left-
solve the flow and transport equations (e.g. finite lateral, and NW-SE right-lateral (Fig. 4 a).
elements and finite differences), the input data have
often been based on discrete maps. The use of data The outcrop (red polygon in Fig. 4 a) has been
from discrete maps ensures reliable results for the circumscribed within a rectangle with the dimensions of
specific model but it makes it difficult extrapolate those 145 and 265 meters. Then, the aforementioned
results to different reservoirs. rectangle has been converted into a geo-cellular volume
(Fig. 4 b). The thickness (height) of the geo-cellular
DFN Model volume has been set at 25 meters, which is the
thickness of the Lower Pleistocene carbonate
Generation of geo-cellular volume and grainstones (Tondi et al., 2012). The volume has been
structural domains divided into squared (map view) cells with a side of 1
m (total number 2.93 x 10⁵).
The DFN model has been built using the Fracture
Modeling module within the commercial MOVETM In order to define domains of the volume
software package from Midland Valley Exploration corresponding to the faults, we calculated the
Ltd. intersection between the interpreted faults and the geo-
cellular volume, (Fig. 5 a). Each one of the two sets
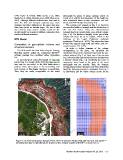
A geo-referenced aerial photograph of Cala San (e.g. left-lateral and right-lateral) has been included into
Nicola (Fig. 4 a; Google Earth, 2012) has been used as a separate domain (Fig. 5 a). Identifying the zones of
base map for our model. In the field faults show a compactive shear bands at the scale of the aerial
positive relief, with respect to the surrounding host photograph was not possible. Thus, the domains
rock, because of their higher resistance to weathering. corresponding to these structures have been determined
Thus, they are easily recognizable on the aerial based the following procedure: orientation from Fig. 2
d; distribution into the whole volume except for the
Figure 4: a) Aerial photograph (Google Earth, 2012) of Cala San Nicola (red), the two fault sets (green =
left-lateral and blue = right lateral) are shown; b) Geo-cellular volume in MOVETM, cell size 1x1 m.
Stanford Rock Fracture Project Vol. 24, 2013 E-5