
Page 6 - RFP_2013_Cilona
P. 6
portion of volume occupied by the faults; length within left-lateral faults). For each set of structures the
distribution from Fig. 3 c; intensity (number/m3) software allows the user to define specific parameters:
estimated from detailed field data in Tondi et al. (2012). Intensity (number/m3); Length; Orientation (Dip
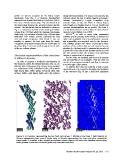
The zone of bands domain (Fig. 5 b) was delimited as azimuth, Angle of dip, and Fisher K value); Aspect
the intersection between the generated planes and the ratio (length over height, fixed at 2 in our model) and
volume. The last domain that we delimited is shown in Aperture (virtual attribute for our model). The Fisher K
Fig. 5 c. It has been defined as the initial geo-cellular is a statistical parameter used to define if a data cloud is
volume (Fig. 4 b) from which the domains representing clustered or not (Fisher et al., 1987).
faults (Fig. 5 a) and zones of bands (Fig. 5 b) have been
subtracted. This volume domain represents the host MOVETM, as well as many other commercial
rock and single compactive shear bands. It was not software used to generate DFN models, is designed for
possible to separate the host rock from the single tight rocks (negligible matrix porosity) where porosity
compactive shear bands because the size of this type of and permeability are provided only by the fractures.
structures (Fig. 3 c) is too small compared to the cells The software assigns null values of porosity to those
of the geo-cellular volume. portions of the volume that are not crosscut by any
structure (i.e. the host rock). It computes the porosity of
Stochastic representation of the structures a given cell as the ratio of total fracture volume in a cell
in different domains per cell volume (where the volume of an individual
fracture is proportional to its aperture).
In order to generate a stochastic representation of
the structures within the defined domains (Fig. 5), six For the rocks we modeled, both host rock porosity
different sets of structures (Fig. 6) have been modeled and permeability are not negligible. Thus we could not
(i.e. right-lateral CSBs; left-lateral CSBs; CSBs within use the aforementioned standard workflow to calculate
right-lateral ZBs; CSBs within left-lateral ZBs; Slip a porosity map of the outcrop.
surfaces within right-lateral faults and Slip surfaces
To address this issue we contrived a work-around,
which allowed us to export the stochastic representation
of the structures (Fig. 6) into a fluid flow simulation
Figure 5: a) Domains representing the two fault sets (green = left-lateral and blue = right lateral); b)
Domain representing two zone of bands sets; c) Domain representing the host rock plus compactive
shear bands, it consists in the original geo-cellular volume (figure 4 b) where the domains representing
faults (picture a) and zone of bands (picture b) have been removed.
Stanford Rock Fracture Project Vol. 24, 2013 E-6