
Page 9 - RFP_2013_Cilona
P. 9
hydraulic conductivity in the horizontal directions (Kxx performed in steady state conditions by imposing
and Kyy), whereas that one in the vertical direction different hydraulic heads at selected points.
(Kzz) is shown in figure 9 (b).
The first simulation was performed with different
Tab. 2: Permeability and hydraulic conductivity hydraulic heads in two opposite corners of the model
values used for the fluid flow simulations (Figure 10 a). The point on the bottom left of the figure
has a hydraulic head of 10 m whereas the top right one
Feature Permeability [D] Hydraulic has a hydraulic head of 2 m. The flow in the “yy”
1 x 100 conductivity [m/d] direction shows a preferential orientation of the flux in
Host rock 5 x 10⁻¹ the oblique “Northeast” direction. It then deviates in
1 x 10⁻² 0.73 correspondence of the centre of the model toward
Adjacent to 3 x 10⁻³ “East” and then concentrates toward “North” (Figure 10
CSB 1 x 10⁻³ 0.37 b). The flow in the “xx” direction has roughly-constant
CSB 1 x 10⁻¹ flux but an increase can be noticed in top right part of
0.0073 the model (Figure 10 c).
ZB 0.0022
0.00073 The second simulation has been performed having 2
Intersection of meter of hydraulic heads at the four corners and 10 m
ZB 0.073 of hydraulic head at the center (Figure 11 a). The flow
Fault in the “yy” direction shows a preferential orientation of
the flux in the oblique “Southeast” direction toward the
Two sets of fluid flow simulations have been carried bottom right corner of the model. The flow in the xx
out by solving the flow and transport equations with direction shows a preferential distribution in the bottom
finite differences approach. Both simulations have been
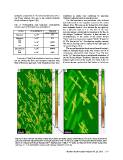
Figure 8: Geo-cellular volumes containing relative porosity values (normalized). The color legend show the
porosity intervals representative of single domains: HR = host rock; CSB = Compactive Shear Bands; ZB =
Zone of Compactive Shear Bands; IZB = Intersection of ZB; F = Faults. a) Volume of the whole study area,
cell size 1 x 1 m; b) Smaller volume with denser cells (0.3 x 0.3 m).
Stanford Rock Fracture Project Vol. 24, 2013 E-9