
Page 8 - RFP_2013_Cilona
P. 8
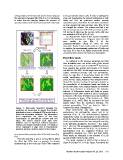
correspondence of the host rock and minimum values at       to the geo-cellular volume cells. In order to address this
the intersection between ZBs (Fig. 8 a). It is interesting  issue, and investigating the internal architecture of both
to notice how the interplay between the presence of         faults and ZBs, we performed another porosity
open slip surfaces and the low-porosity fault rocks leads   calculation (same workflow). For this latter calculation
                                                            we kept unvaried the same structure array (Fig. 6) but
  Figure 7: Schematic flowchart showing the                 we changed the volume. The volume used had a top
  workflow we developed to export the fracture              face area measuring one ninth of the previous one (50 x
  distribution from a standard DFN model into a             312 m; Fig. 8). Moreover the top face of the cells area
  fluid flow simulation software. The bifurcation           was reduced to 0.09 m2 (0.3 x 0.3 m).
  point represents the choice of the best
  combination of geo-cellular volume and cell                   As expected the result of this second calculation
  sizes. The boxes around each step have                    mirrored the previous one. However, since the cells
  different color to represent software operation           were smaller in size (Fig. 8 b), the
  (violet) and manual operation (red). The dashed           compartmentalization effects of CSBs are now
  arrow represent a step that is theoretically              detectable. Thanks to this smaller volume, it is possible
  possible but has not been done for this model.            to visualize the anastomosing architecture of faults and
to an intermediate porosity value of the fault zones (Fig.  ZBs (Fig. 8 b). Due to its higher accuracy the second
8 a).                                                       volume has been used for the fluid flow simulations.

    From the map (Fig. 8 a) it is not possible to detect    Fluid flow tests
the effect that CBSs have on porosity. As already
mentioned this is due to the size of the CSBs compared          As explained in the previous paragraph, the fluid
                                                            flow simulation were run at the scale of the second
                                                            volume (Fig. 8 b). The data from MOVETM format have
                                                            been exported into generic ascii format to be loaded
                                                            into MODFLOW 2005. At this stage it was necessary to
                                                            replace normalized porosity with real permeability.
                                                            Since the map (Fig. 8 b) perfectly match the DFN
                                                            model, establishing a correlation between the color
                                                            codes and the single structures was straight forward.
                                                            Despite the literature lacking of systematic dataset on
                                                            the permeability of deformation bands and faults in
                                                            porous carbonates, very complete datasets are available
                                                            for the same structures in sandstones. The hydraulic
                                                            behavior of deformation bands and faults in porous
                                                            carbonates (Tondi, 2007; Rath et al, 2011) is analogous
                                                            to that one of the same structures in porous sandstones
                                                            (e.g. Antonellini & Aydin, 1994; Sternlof et al., 2006;
                                                            Ahmadov et al., 2007). Thus for our model we used
                                                            typical values from the sandstones literature. The
                                                            selected permeability “Kxx” are listed in Table 1
                                                            (expressed in orders of magnitude).

                                                                Since MODFLOW only deals with hydraulic
                                                            conductivity, the permeability values had to be
                                                            converted (Tab. 2). The aforementioned hydraulic
                                                            conductivity values are representative of one direction
                                                            (Kxx), the other two principal directions (Kyy and Kzz)
                                                            of the permeability tensor have been assigned according
                                                            to the following assumption: Kxx=Kyy < Kzz (where
                                                            Kzz = 10 Kxx). This assumption is justified by the fact
                                                            that within fault zones and ZBs (Fig. 2 b, c), lenses of
                                                            less-deformed rock are comprised between low-
                                                            permeability structures (i.e. CSBs and fault rocks).

                                                            These lenses are elongated in the direction of 2 (in
                                                            agreement with Fossen & Bale, 2007).

                                                                The model imported in MODFLOW is shown in
                                                            Figure 8 (cell size 0.5 x 0.5 m). Figure 9 (a) shows the

                                                            Stanford Rock Fracture Project Vol. 24, 2013 E-8