
Page 7 - RFP_2013_Cilona
P. 7
software. A schematic representation of the workflow It is important to underline that the use of aperture is
we followed is shown in figure 7. We transferred a appropriate for slip surfaces (faults) but not for
virtual opening (proxy of the porosity) attribute compactive shear bands and zones of bands. Indeed
characteristic of each set of structures onto the volume. these latter structures are not discrete discontinuities
Arbitrary values of apertures (Tab.1) have been and they are characterized by a negative volumetric
assigned to single compactive shear bands, CSBs within strain (e.g. Aydin et al., 2006). The virtual apertures
zone of bands and slip surfaces within faults in order to were set inversely proportional to the sealing potential
track their position in the volume. of the structures, which is minimum for slip surfaces,
maximum for zone of bands and intermediate for
Tab. 1: Values of virtual aperture that have been compactive shear bands (Tab. 1). These aperture
(porosity) values were used as a tag to identify each
attributed to each structures set in relation with its individual structure, but did not play any direct role into
relative sealing potential the fluid flow simulations.
Feature Relative sealing Virtual aperture The software calculated a porosity distribution due
Single CSB potential [mm] to the structures, finally we manually replaced the null
values of those cells representing the host rock (Fig. 7)
Intermediate 5 x 10⁻³ with real porosity values published by Tondi et al.
(2012).
CSBs within ZBs Maximum 1 x 10⁻³
Minimum 5 x 10⁻¹ The porosity distribution shown in Fig. 8 is
Slip surface normalized to one, it shows maximum values in
(Fault)
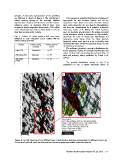
Figure 6: a) DFN made up of six different sets of deformation features represented by different colors; g)
Close up of the DFN, each set of structures has been populated within a specific domain.
Stanford Rock Fracture Project Vol. 24, 2013 E-7