
Page 12 - 2014_A_preliminary_energy
P. 12
L. de Santoli et al. / Sustainable Energy Technologies and Assessments 8 (2014) 42–56 53
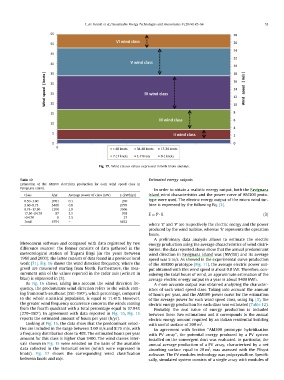
Fig. 17. Wind classes values expressed in both knots and m/s.
Table 12 Estimated energy outputs
Estimation of the AM300 electricity production for each wind speed class in
Favignana island. In order to obtain a realistic energy output, both the Favignana
island wind characteristics and the power curve of AM300 proto-
Class h/yr Average power of class (kW) E (kWh/yr) type were used. The electric energy output of the micro wind tur-
bine is expressed by the following Eq. (3).
0.50–3.60 2001 0.1 200
3.60–8.75 3408 0.8 2795 E¼PÁh ð3Þ
8.75–17.50 1200 2.9 3506
17.50–24.70 3.5 where ‘E’ and ‘P’ are respectively the electric energy and the power
>24.70 87 3.5 303 produced by the wind turbine, whereas ‘h’ represents the operation
Total 8 – 27 hours.
6704 6832 A preliminary data analysis allows to estimate the electric
energy production using the average characteristics of wind distri-
Meteonorm software and compared with data registered by two bution: the data reported above show that the annual predominant
difference sources: the former consists of data gathered in the wind direction in Favignana island was (NW/SE) and its average
meteorological station of Trapani Birgi (in the years between speed was 5 m/s. As showed in the experimental curve production
1960 and 2000); the latter consists of data found in a previous local of the AM300 prototype (Fig. 11), the average electric power out-
work [71]. Fig. 16 shows the wind direction frequency, where the put obtained with this wind speed is about 0.8 kW. Therefore, con-
greed are measured starting from North. Furthermore, the mea- sidering the total hours of wind, an approximate estimation of the
surement unit of the values reported in the radar axis (written in average electric energy output in a year is about 5400 kWh.
blue) is expressed in (%).
A more accurate output was obtained analyzing the character-
As Fig. 16 shows, taking into account the wind direction fre- istics of each wind speed class. Taking into account the amount
quency, the predominant wind direction refers to the winds com- of hours per year, and the AM300 power curve for the estimation
ing from South-southeast (SSE–150°), which percentage, compared of the average power for each wind speed class, using Eq. (3), the
to the whole statistical population, is equal to 11.41%. However, electric energy production for each class was estimated (Table 12).
the greater wind frequency occurrence concerns the winds coming
from the fourth quadrant with a total percentage equal to 37.94% Probably the real value of energy production is included
(270–360°). In agreement with data reported in Fig. 16, Fig. 15 between these two estimations and it corresponds to the annual
reports the estimated amount of hours per year (h/yr). electric energy amount required by an Italian residential building
with useful surface of 200 m2.
Looking at Fig. 15, the data show that the predominant veloci-
ties are included in the range between 3.60 m/s and 8.75 m/s, with In agreement with Section ‘‘AM300 prototype hybridization
a frequency distribution close to 40%. The estimated hours per year with PV array’’, the potential energy produced by a PV system
amount for this class is higher than 3400. The wind classes inter- installed on the convergent duct was evaluated. In particular, the
vals shown in Fig. 15 were selected on the basis of the available annual average production of a PV array, characterized by a net
data collected in the historical series (which were expressed in absorbing surface equal to 20 m2, was assessed with the PVsyst
knots). Fig. 17 shows the corresponding wind classification software. The PV modules technology was polycrystalline. Specifi-
between knots and m/s. cally, simulated system consists of a single array with modules of