
Page 10 - 2014_A_preliminary_energy
P. 10
L. de Santoli et al. / Sustainable Energy Technologies and Assessments 8 (2014) 42–56 51
Table 8 globally emitted in the atmosphere is an important environmental
Noise level of three different turbines [47]. benefit from wind power generation. Furthermore, another signif-
icant advantage of wind power is its clean energy generation, with-
Noise level H-Rotor Darrieus HAWT out CO2, SO2 and NOx emissions. These are the main pollutants
Low Moderate High directly connected with other kinds of electricity generation
sources such as coal, gas, oil, biomass, waste, etc.
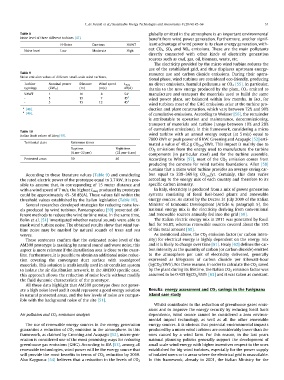
Table 9
Noise emission values of different small-scale wind turbines. The electricity provided by the micro wind turbine reduces the
use of the established grid, and thus displaces upstream energy-
Turbine Nominal power Distance Wind speed LAeq resource use and carbon dioxide emissions. During their opera-
typology (kWel) (m) (m/s) dB(A) tional phase, wind turbines are considered eco-friendly, producing
no direct emissions, harmful pollutants or CO2 [55]. In particular,
VAWT 1 10 8 54a thanks to the new energy produced by the plant, CO2 emitted to
- 5 15 7 45b manufacture and transport the materials used to build the same
- 5 15 12 45b wind power plant, are balanced within few months. In fact, for
wind turbines most of the GHG emissions arise at the turbine pro-
a [48]. duction and plant construction, which vary between 72% and 90%
b [46]. of cumulative emissions. According to Weisser [56], the remainder
is attributable to operation and maintenance, decommissioning,
Table 10 transport of materials and turbine (range between 10% and 28%
Italian limit values of LAeq [49]. of cumulative emissions). In this framework, considering a micro
wind turbine with an annual energy output (at 5 m/s) equal to
Territorial class Reference times Nighttime 7800 kWh or peak power of 6 kW, Greening and Azapagic [52] esti-
Protected areas (22 pm–6 am) mated a value of 48.2 g CO2eq/kWh. This impact is mainly due to
Daytime CO2 emissions from the energy used to manufacture the turbine
(6 am–22 pm) 40 components (in particular steel) and for the turbine assemble.
According to White [57], most of the CO2 emission comes from
50 producing the concrete for wind turbine foundations. Allen [58]
sustains that a micro wind turbine provides an average saving car-
According to these literature values (Table 9) and considering bon equal to 238–369 kg CO2eq/yr. Certainly, this data varies
the rated electric power of the prototype equal to 3.7 kW, it is pos- according to the energy mix of each country and therefore to its
sible to assume that, in corresponding of 15 meter distance and specific carbon intensity.
with a wind speed of 7 m/s, the highest LAeq produced by prototype
could be approximately 45–50 dB(A). These values fall within the In Italy, electricity is produced from a mix of power generation
threshold values established by the Italian legislation (Table 10). systems consisting of fossil fuel-based plants and renewable
energy sources. As stated by the Decree 31 July 2009 of the Italian
Several researches developed strategies for reducing noise lev- Minister of Economic Development (Article 6, paragraph 5), the
els produced by wind turbines. Pantazopoulou [50] presented dif- national energy mix is the electricity deriving from conventional
ferent methods to reduce the wind turbine noise. In the same time, and renewable sources annually fed into the grid [59].
Bolin et al. [51] investigated whether natural sounds were able to
mask wind turbine noise. The obtained results show that wind tur- The Italian electric energy mix in 2011 was generated by fossil
bine noise may be masked by natural sounds of trees and sea fuel for 56.8%, whereas renewable sources covered about the 35%
waves. of this total amount [60].
These sentences confirm that the estimated noise level of the As mentioned above, the CO2 emission factor (or carbon inten-
AM300 prototype is masking by natural sound and wave noise, this sity) for electrical energy is highly dependent on the energy mix
aspect is more relevant if the installation area is close to the coast- and it is likely to change over time [61]. Healy [62] defines the car-
line. Furthermore, it is possible to obtain an additional noise reduc- bon intensity as the quantity of carbon (or carbon dioxide) emitted
tion covering the convergent duct surface with soundproof to the atmosphere per unit of electricity delivered, generally
materials. This solution is traditionally used in air condition system expressed as kilograms of carbon dioxide per kilowatt-hour
to isolate the air distribution network. In the AM300 specific case, (kgCO2/kWh). For these reasons, in order to calculate the CO2 saved
this approach allows the reduction of noise levels without modify by the plant during its lifetime, the Italian CO2 emission factor was
the fluid dynamic characteristic of the prototype. assumed to be 0.435 kgCO2/kWh [63] and it was taken as constant.
All these data highlight that AM300 prototype does not gener- Results: energy assessment and CO2 savings in the Favignana
ate a high noise level and it could represent a good energy solution island case study
in natural protected areas, and the low levels of noise are compat-
ible with the background noise of the site [51]. Whilst contributes to the reduction of greenhouse gases emis-
sions and to improve the energy security by reducing fossil fuels
Air pollution and CO2 emissions analysis dependence, wind source cannot be considered a zero environ-
mental impact technology, as well as all the other renewable
The use of renewable energy sources in the energy generation energy sources. It is obvious that potential environmental impacts
guaranties a reduction of CO2 emission in the atmosphere. In this produced by a micro wind turbines are considerably lower than the
framework, as claimed by Greening and Azapagic [52], micro-gen- ones caused by a wind farm. For this reason, in the last years
eration is considered one of the most promising ways for reducing national planning policies generally support the development of
greenhouse gas emissions (GHG). According to IEA [53], among all small scale wind energy with higher incentives respect to the ones
renewable technologies, wind power will be the energy source that established for big wind turbines, especially for the power supply
will provide the most benefits in terms of CO2 reduction by 2050. of isolated users or in areas where the electrical grid is unavailable.
Also Kaygusuz [54] believes that a reduction in the levels of CO2 In this framework, already in 2001, the Italian Ministry for the