
Page 5 - 2014_A_preliminary_energy
P. 5
46 L. de Santoli et al. / Sustainable Energy Technologies and Assessments 8 (2014) 42–56
flow and a viscous fluid were supposed. In Table 4, the specific Test rig description
boundary conditions imposed to the control volume are In order to evaluate the speed-up effect on the power produc-
tion a measurement campaign of five months was realized in the
summarized. area of Monghitoro, an Italian small municipality near Bologna
(Fig. 10).
The outflow boundary conditions are used to model flow exits
In particular, simultaneous measurements of the Pel produced by
where the details of the flow velocity and pressure are not known the H-Darreus Stadard and AM300 turbine were performed. The
two power curves were obtained under the same working condi-
prior to solution of the flow problem. The velocity inlet boundary tions. The comparison of these two curves represents an useful tool
for estimating the speed up effect produced by the convergent duct.
condition is used to define the flow speed in the inlet section and
To obtain significant wind speed data, an anemometric mea-
it is intended for incompressible flows [29]. Furthermore, these surements were carried out using an anemometric station com-
posed by an anemometer, a wind vane and a data acquisition
boundary conditions allow to estimate the steady speed and the system. Furthermore, in order to minimize the disturbance effect
on measurements, this station was located at a distance of 10
pressure profile in the internal control volume. Furthermore, in meters from the wind turbines. Since the wind turbines are
VAWTs, the wind speed was measured at 6.5 m (turbine center-
order to consider major head losses, a roughness level of internal line). Tables 5 and 6 report respectively the anemometer wind
speed and the wind vane data sheet.
surface duct was assumed. The complete CFD analysis was realized
The monitoring of the electrical power produced by the turbine
using the Fluent 6.3 software. was realized with a data acquisition system which consists of an
electrical power meter, and of a device for collecting and process-
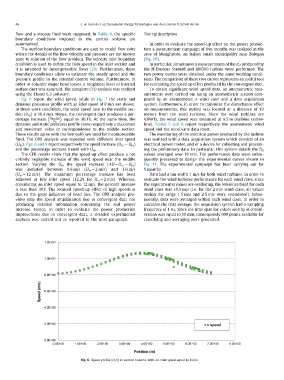
Fig. 6 report the wind speed, while in Fig. 7 the static and ing the preliminary data. In particular, this system details the Pel
values averaged over 10 min. The performance data were subse-
dynamic pressures profile with an inlet speed of 8 m/s are shown. quently processed to design the experimental curves shown in
Fig. 11. The experimental campaign has been carrying out for
In these work conditions, the wind speed near to the middle sec- 5 months.
tion (Um) is 10.4 m/s. Hence, the convergent duct produces a per- Data had a bin width 1 m/s for both wind turbines. In order to
Um ÀUin evaluate the wind turbines performance for each wind class, since
centage increase Uin equal to 30.1%. At the same time, the the experimental values are oscillating, the reference band for each
wind class was ±0.5 m/s (i.e. for the 2 m/s wind class, all values
dynamic and static pressures profile show respectively a maximum within the range 1.5 m/s and 2.5 m/s were considered). Subse-
quently, data were averaged within each wind class. In order to
and minimum value in correspondence to the middle section. calculate the data average, the acquisition system had a sampling
frequency of 1 Hz. Since the time span for values worthy of consid-
These results agree with the Bernoulli law used for incompressible eration was equal to 10 min, consequently 600 points available for
classifying and averaging were generated.
fluid. The CFD analysis was repeated with different inlet speed
(Uin). Figs. 8 and 9 report respectively the speed increase (Um À Uin)
and the percentage increase trends with Uin.
The CFD results show that the speed up effect produce a not
entirely negligible increase of the wind speed near the middle
section. Varying the Uin the speed increase (DU = Um À Uin)
was included between 0.6 m/s (Uin = 2 m/s) and 3.6 m/s
(Uin = 12 m/s). The maximum percentage increase has been
achieved at low inlet speed (32.2% for Uin = 2 m/s). Whereas,
considering an inlet speed equal to 12 m/s, the percent increase
is less than 30%. The reduced speed-up effect of high speeds is
due to the great influence of head loss. The CFD analysis pro-
vides only the speed amplification due to convergent duct not
producing detailed information concerning the real power
increase. Hence, in order to evaluate the power production
improvement due to convergent duct, a detailed experimental
analysis was carried out as reported in the next paragraph.
Fig. 6. Speed profile (m/s) in control volume, with an inlet speed equal to 8 m/s.