
Page 8 - 2014_A_preliminary_energy
P. 8
L. de Santoli et al. / Sustainable Energy Technologies and Assessments 8 (2014) 42–56 49
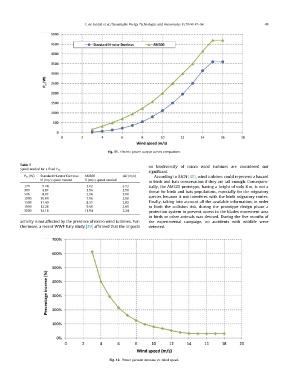
Fig. 11. Electric power output curves comparison.
Table 7 on biodiversity of micro wind turbines are considered not
Speed needed for a fixed Pel. significant.
Pel (W) Standard H-rotor Darrieus AM300 DU (m/s) According to IUCN [40], wind turbines could represent a hazard
U (m/s) speed needed U (m/s) speed needed to birds and bats conservation if they are tall enough. Consequen-
2.72 tially, the AM300 prototype, having a height of only 8 m, is not a
170 5.74 3.02 2.90 threat for birds and bats populations, especially for the migratory
300 6.87 3.96 3.00 species because it not interferes with the birds migratory routes.
500 8.07 5.06 2.98 Finally, taking into account all the available information, in order
1000 10.04 7.06 2.83 to limit the collision risk, during the prototype design phase a
1500 11.40 8.57 2.69 protection system to prevent access to the blades movement area
1900 12.28 9.60 2.24 to birds or other animals was devised. During the five months of
3000 14.18 11.94 the experimental campaign, no accidents with wildlife were
detected.
activity is not affected by the presence of micro wind turbines. Fur-
thermore, a recent WWF Italy study [39] affirmed that the impacts
Fig. 12. Power percent increase vs. wind speed.