
Page 7 - Caruso_Zaccone_2000
P. 7
LAP ACTIVITY IN AQUATIC ECOSYSTEMS 957
(a)
3 6 (b)
3 6
log µg C l –1 h –1 2 4 2 log cfu ml –1 log µg C l –1 h –1 2 1 4 2 log cfu ml –1
1
0 0 0 0
F MAM J J A S ON D J M F MAM J J A S ON D J M
(c) (d)
3 6 3 6
log µg C l –1 h –1 2 4 2 log cfu ml –1 log µg C l –1 h –1 2 1 4 2 log cfu ml –1
1
0 0 0 0
F MAM J J A S ON D J M F MAM J J A S ON D J M
(e) (f)
3 6 3 6
log µg C l –1 h –1 2 4 2 log cfu ml –1 log µg C l –1 h –1 2 4 2 log cfu ml –1
1
1
0 0 0 0
F MAM J J A S ON D J M F MAM J J A S ON D J M
ÿ1
ÿ1
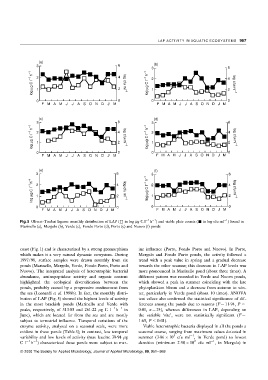
Fig. 5 Oliveri-Tindari lagoon: monthly distribution of LAP (& in log mg C l ÿ1 h ) and viable plate counts (& in log cfu ml ) found in
Marinello (a), Mergolo (b), Verde (c), Fondo Porto (d), Porto (e) and Nuovo (f) ponds
coast (Fig. 1) and is characterized by a strong geomorphism ine in¯uence (Porto, Fondo Porto and Nuovo). In Porto,
which makes it a very natural dynamic ecosystem. During Mergolo and Fondo Porto ponds, the activity followed a
1997/98, surface samples were drawn monthly from six trend with a peak value in spring and a gradual decrease
ponds (Marinello, Mergolo, Verde, Fondo Porto, Porto and towards the other seasons; this decrease in LAP levels was
Nuovo). The integrated analysis of heterotrophic bacterial more pronounced in Marinello pond (about three times). A
abundance, aminopeptidase activity and organic content different pattern was recorded in Verde and Nuovo ponds,
highlighted the ecological diversi®cation between the which showed a peak in summer coinciding with the late
ponds, probably caused by a progressive con®nement from phytoplankton bloom and a decrease from autumn to win-
the sea (Leonardi et al. 1998b). In fact, the monthly distri- ter, particularly in Verde pond (about 10 times). ANOVA
bution of LAP (Fig. 5) showed the highest levels of activity test values also con®rmed the statistical signi®cance of dif-
in the most brackish ponds (Marinello and Verde with ferences among the ponds due to seasons (F 1194, P <
peaks, respectively, of 31385 and 26122 mg C l ÿ1 h ÿ1 in 001, n 24), whereas differences in LAP, depending on
June), which are located far from the sea and are mostly the variable `site', were not statistically signi®cant (F
subject to terrestrial in¯uence. Temporal variations of the 165, P < 001).
enzyme activity, analysed on a seasonal scale, were more Viable heterotrophic bacteria displayed in all the ponds a
evident in these ponds (Table 3); in contrast, less temporal seasonal course, ranging from maximum values detected in
ÿ1
5
variability and low levels of activity (max leucine 3994 mg summer (386 10 cfu ml , in Verde pond) to lowest
ÿ1
2
ÿ1
C l ÿ1 h ) characterized those ponds more subject to mar- densities (minimum 250 10 cfu ml , in Mergolo) in
= 2000 The Society for Applied Microbiology, Journal of Applied Microbiology, 89, 951ÿ959