
Page 10 - Ciappa_Costabile_2014
P. 10
A. Ciappa, S. Costabile / Marine Pollution Bulletin 84 (2014) 44–55 53
Fig. 8. Monthly distributions of maximum probability and number of receptor points per interval of the arrival time. The mean values of maximum percentage (0.17%) and
number of receptor points (44) at the arrival time of 72 h (3 days) were arbitrarily chosen as thresholds for obtaining monthly risk maps around the MPA.
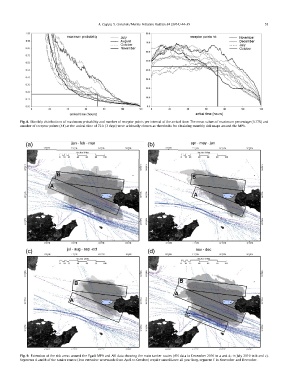
Fig. 9. Extension of the risk areas around the Egadi MPA and AIS data showing the main tanker routes (AIS data in December 2010 in a and d; in July 2010 in b and c).
Segments A and B of the tanker routes (less extensive westwards from April to October) require surveillance all year long, segment C in November and December.