
Page 8 - Ciappa_Costabile_2014
P. 8
A. Ciappa, S. Costabile / Marine Pollution Bulletin 84 (2014) 44–55 51
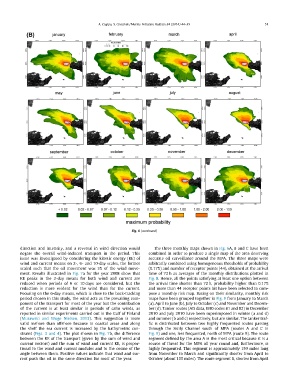
Fig. 6 (continued)
direction and intensity, and a reversal in wind direction would The three monthly maps shown in Fig. 6A, B and C have been
negate the overall wind-induced transport in the period. This combined in order to produce a single map of the area deserving
issue was investigated by considering the kinetic energy (KE) of accurate oil surveillance around the MPA. The three maps were
wind and current means on 2-, 6- and 10-day scales, the former arbitrarily combined using homogeneous thresholds of probability
scaled such that the oil movement was 3% of the wind move- (0.17%) and number of receptor points (44), obtained at the arrival
ment. Results illustrated in Fig. 7a for the year 2008 show that time of 72 h as averages of the monthly distributions plotted in
KE peaks in the 2-day means for both wind and current are Fig. 8. Hence, all the points satisfying at least one option between
reduced when periods of 6 or 10 days are considered, but the the arrival time shorter than 72 h, probability higher than 0.17%
reduction is more evident for the wind than for the current. and more than 44 receptor points hit have been selected to com-
Focusing on the 6-day means, which is close to the back-tracking pose a monthly risk map. Basing on their similarity, monthly risk
period chosen in this study, the wind acts as the prevailing com- maps have been grouped together in Fig. 9 from January to March
ponent of the transport for most of the year but the contribution (a), April to June (b), July to October (c) and November and Decem-
of the current is at least similar in periods of calm winds, as ber (d). Tanker routes (AIS data, IMO codes 81 and 82) in December
reported in similar experiments carried out in the Gulf of Finland 2010 and July 2010 have been superimposed in winter (a and d)
(Murawski and Woge Nielsen, 2013). This suggestion is more and summer (b and c) respectively, but are similar. The tanker traf-
valid inshore than offshore because in coastal areas and along fic is distributed between two highly frequented routes passing
the shelf the sea current is increased by the bathymetric con- through the Sicily Channel south of MPA (routes A and C in
straint (Figs. 3 and 4). The plot shown in Fig. 7b, the difference Fig. 9) and one, less frequented, north of MPA (route B). The route
between the KE of the transport (given by the sum of wind and segment defined by the area A is the most critical because it is a
current vectors) and the sum of wind and current KE, is propor- source of threat for the MPA all year round and, furthermore, is
tional to the wind and current modules and to the cosine of the highly frequented. This segment is approximately 150 miles long
angle between them. Positive values indicate that wind and cur- from November to March and significantly shorter from April to
rent push the oil in the same direction for most of the year. October (about 100 miles). The route segment B, shorter from April