
Page 6 - Ciappa_Costabile_2014
P. 6
A. Ciappa, S. Costabile / Marine Pollution Bulletin 84 (2014) 44–55 49
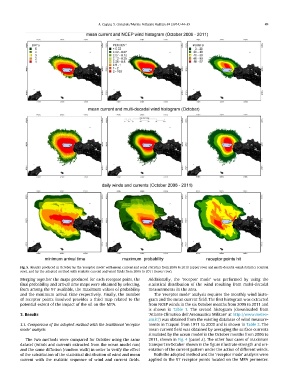
Fig. 5. Results produced in October by the ‘receptor mode’ with mean current and wind statistics from 2006 to 2011 (upper row) and multi-decadal wind statistics (central
row), and by the adopted method with realistic current and wind fields from 2006 to 2011 (lower row).
Merging together the maps produced for each receptor point, the Additionally, the ‘receptor mode’ was performed by using the
final probability and arrival time maps were obtained by selecting, statistical distribution of the wind resulting from multi-decadal
from among the 97 available, the maximum values of probability measurements in the area.
and the minimum arrival time respectively. Finally, the number The ‘receptor mode’ analysis requires the monthly wind histo-
of receptor points involved provides a third map related to the gram and the mean current field. The first histogram was extracted
potential extent of the impact of the oil on the MPA. from NCEP winds in the six October months from 2006 to 2011 and
is shown in Table 1. The second histogram (downloaded from
3. Results ‘Atlante Climatico dell’Areonautica Militare’ at http://www.meteo-
am.it/) was obtained from the existing database of wind measure-
3.1. Comparison of the adopted method with the traditional ‘receptor ments in Trapani from 1971 to 2000 and is shown in Table 2. The
mode’ analysis mean current field was obtained by averaging the surface currents
simulated by the ocean model in the October months from 2006 to
The two methods were compared for October using the same 2011, shown in Fig. 4 (panel a). The other four cases of maximum
dataset (winds and currents extracted from the ocean model run) transport in October shown in the figure illustrate strength and ori-
and the same diffusion (random walk) in order to verify the effect entation of the current pattern under the action of different winds.
of the substitution of the statistical distribution of wind and mean Both the adopted method and the ‘receptor mode’ analysis were
current with the realistic sequence of wind and current fields. applied to the 97 receptor points located on the MPA perimeter.