
Page 7 - Ciappa_Costabile_2014
P. 7
50 A. Ciappa, S. Costabile / Marine Pollution Bulletin 84 (2014) 44–55
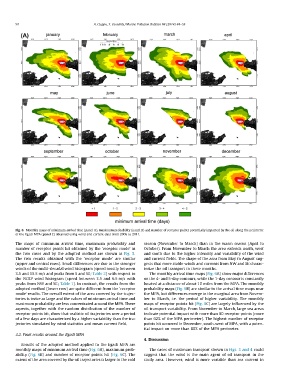
Fig. 6. Monthly maps of minimum arrival time (panel A), maximum probability (panel B) and number of receptor points potentially impacted by the oil along the perimeter
of the Egadi MPA (panel C) obtained using wind and current data from 2006 to 2011.
The maps of minimum arrival time, maximum probability and season (November to March) than in the warm season (April to
number of receptor points hit obtained by the ‘receptor mode’ in October). From November to March the area extends north, west
the two cases and by the adopted method are shown in Fig. 5. and south due to the higher intensity and variability of the wind
The two results obtained with the ‘receptor mode’ are similar and current fields. The shape of the area from May to August sug-
(upper and central rows). Small differences are due to the stronger gests that more stable winds and currents from NW and SE charac-
winds of the multi-decadal wind histogram (speed mostly between terize the oil transport in these months.
3.5 and 15.5 m/s and peaks from S and SE; Table 2) with respect to The monthly arrival time maps (Fig. 6A) show major differences
the NCEP wind histogram (speed between 3.5 and 6.5 m/s with on the 4- and 5-day contours, while the 1-day contour is constantly
peaks from NW and SE; Table 1). In contrast, the results from the located at a distance of about 10 miles from the MPA. The monthly
adopted method (lower row) are quite different from the ‘receptor probability maps (Fig. 6B) are similar to the arrival time maps near
mode’ results. The overall extent of the area covered by the trajec- the MPA, but differences emerge in the marginal area from Novem-
tories is twice as large and the values of minimum arrival time and ber to March, i.e. the period of higher variability. The monthly
maximum probability are less concentrated around the MPA. These maps of receptor points hit (Fig. 6C) are largely influenced by the
aspects, together with the random distribution of the number of oil transport variability. From November to March, large sea areas
receptor points hit, show that realistic oil trajectories over a period indicate potential impact with more than 60 receptor points (more
of a few days are characterized by a higher variability than the tra- than 62% of the MPA perimeter). The highest number of receptor
jectories simulated by wind statistics and mean current field. points hit occurred in December, south-west of MPA, with a poten-
tial impact on more than 80% of the MPA perimeter.
3.2. Final results around the Egadi MPA
4. Discussion
Results of the adopted method applied to the Egadi MPA are
monthly maps of minimum arrival time (Fig. 6A), maximum prob- The cases of maximum transport shown in Figs. 3 and 4 could
ability (Fig. 6B) and number of receptor points hit (Fig. 6C). The suggest that the wind is the main agent of oil transport in the
extent of the area covered by the oil trajectories is larger in the cold study area. However, wind is more variable than sea current in