
Page 16 - Franzitta_et_alii_2017
P. 16
Sustainability 2017, 9, 106 16 of 19
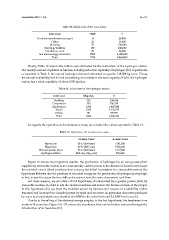
Table 11. Initial costs of the wave farm.
Item Cost €/kW €
On-shore transformers and grid 18 28,800
Cables 12 19,200
Mooring 75 120,000
Building/facilities 150 240,000
Installation work 35 56,000
Sea wave energy converters 2500 4,000,000
Total 2790 4,464,000
Finally, Table 12 reports the initial costs estimated for the realization of the hydrogen station.
The unitary costs are expressed in function of daily production capability of hydrogen [30]. In particular,
as reported in Table 5, the annual hydrogen demand estimated is equal to 318,588 kg/year. Fixing
the annual availability to 0.97 and considering an increase in the total capacity of 20%, the hydrogen
station has a rated capability of about 1080 kg/day.
Table 12. Initial costs of the hydrogen station.
Item Cost €/kg Day €
Building 310 334,740
Compressor 330 356,336
Electrolyzer 1320 1,425,345
Vessel 1050 1,133,797
Others 50 53,990
Total 3060 3,304,209
As regards the operative and maintenance costs, we consider the values reported in Table 13.
Table 13. Operative and maintenance costs.
Unitary Costs Annual Costs
Wave farm 55 €/(kW-year) €181,500
Wind farm 47 €/(kW-year) €155,100
Biomass power plant 98 €/(kW-year) €117,600
Hydrogen station 48 €·day/(kg-year) €52,068
Figure 15 shows two important results: the production of hydrogen by an own-power plant
supplied by renewable sources is not economically viable (at least in the absence of incentives) because
the avoided cost of diesel purchase does not pay the initial investment in a reasonable period; the
hypothesis B shows that the purchase of electrical energy for the production of hydrogen is very high,
in fact, in just five years the two different scenarios have the same discounted cash flow.
For these reasons, we simulate a third hypothesis, characterized by a greater power plant by
renewable sources, in order to sell the electrical surplus and reduce the breakeven time of the project.
In this hypothesis (C), we fixed the installed power by biomass (for reasons of availability of this
resource) and increased the installed power by wind and sea wave. In particular, the power produced
by wave and wind plants was doubled (6.6 MW for the wind farm and 3.2 MW for sea wave).
Thanks to the selling of the electrical energy surplus, in the last hypothesis, the breakeven time
is about 14 years (see Figure 16). Of course, the breakeven time can be further reduced through the
introduction of an incentive [31].