
Page 12 - Franzitta_et_alii_2017
P. 12
Sustainability 2017, 9, 106 12 of 19
reports the overall annual distance covered by the hydrogen bus fleet, the corresponding hydrogen
demand and the avoided diesel consumption, in the four scenarios.
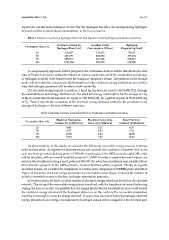
Table 5. Distance covered by hydrogen fleet and fuel request in four hydrogen penetration scenarios.
Distance Covered by Avoided Diesel Hydrogen
Penetration Rate [%]
Hydrogen Fleet [km] Consumption [L/Year] Request [kg/Year]
25 318,587 127,435 79,647
50 637,175 254,870 159,294
75 955,762 382,305 238,941
100 1,274,350 509,740 318,588
A compensatory approach will be proposed: the conversion devices will be installed in the best
sites of Trapani’s province without territorial or marine constraints, while the production and storage
of hydrogen is useful to be realized near the transport company’s venue. The presence of the storage
tanks will be helpful to compensate the fluctuations of the electrical energy production and, in this
way, the hydrogen generator will be able to work optimally.
The electrical energy request to produce 1 kg of H 2 has been set equal to 56.3 kWh [22], through
the electrodialysis technology. Furthermore, the electrical energy consumption for the storage of 1 kg
of H 2 in compressed form has been set equal to 3.35 kWh [23], for a global request of 59.65 kWh/kg
of H 2 . Table 6 reports the evaluation of the electrical energy demand related to the production and
storage of hydrogen in the four different scenarios.
Table 6. Electrical energy demand in the four hydrogen penetration scenarios.
Electrical Demand to Electrical Demand to Total Electrical
Penetration Rate [%]
Produce H 2 [GWh/Year] Store H 2 [GWh/Year] Demand [GWh/Year]
25 4.49 0.27 4.75
50 8.97 0.53 9.50
75 13.50 0.80 14.25
100 17.94 1.07 19.00
As shown before, in this study, we consider the following renewable energy sources: biomass,
wind and sea wave. As regards the biomass source, we consider the installation of several ORC units,
each one having a rated electrical power of 150 kW; in particular, in the 100% scenario, eight ORC units
will be installed, with an overall installed power of 1.2 MW. In order to exploit the wind source, we
selected wind turbines, having a rated power of 330 kW. The rotor has a horizontal axis, installed about
50 m from the ground. In the 100% scenario, 10 wind turbines will be required. Finally, as regards
sea wave source, we consider the installation of a wave farm composed of 20 DEIM point absorbers.
Figure 12 shows the electrical energy production by renewable source; Figure 13 shows the number of
units by renewable source in the four hydrogen penetration scenarios.
In every scenario, we have a modest surplus of electrical energy, which can be sold on the electrical
network. The sizing of the renewable energy plants is realized, with the hypothesis of annual balancing.
During the year, of course, it is possible that the energy production by renewable sources could exceed
the electrical energy demand of the hydrogen station or on the contrary the renewable production
could be not enough to cover the energy demand. In every case, the role of balancing between electrical
energy production and energy consumption by hydrogen station will be assigned to the electrical grid.