
Page 13 - Franzitta_et_alii_2017
P. 13
Sustainability 2017, 9, 106 13 of 19
Sustainability 2017, 9, 106 13 of 19
absorbers. Figure 12 shows the electrical energy production by renewable source; Figure 13 shows
Sustainability 2017, 9, 106 13 of 19
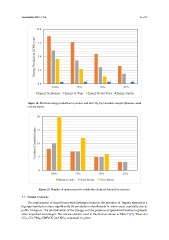
absorbers. Figure 12 shows the electrical energy production by renewable source; Figure 13 shows
the number of units by renewable source in the four hydrogen penetration scenarios.
the number of units by renewable source in the four hydrogen penetration scenarios.
Figure 12. Electrical energy production to produce and store H2, by renewable energies (biomass,
Figure 12. Electrical energy production to produce and store H 2 , by renewable energies (biomass, wind
Figure 12. Electrical energy production to produce and store H2, by renewable energies (biomass,
wind and sea wave).
and sea wave).
wind and sea wave).
Figure 13. Number of units required to satisfy the electrical demand, by scenario.
Figure 13. Number of units required to satisfy the electrical demand, by scenario.
Figure 13. Number of units required to satisfy the electrical demand, by scenario.
In every scenario, we have a modest surplus of electrical energy, which can be sold on the
In every scenario, we have a modest surplus of electrical energy, which can be sold on the
4.2. Avoided Emissions
electrical network. The sizing of the renewable energy plants is realized, with the hypothesis of
electrical network. The sizing of the renewable energy plants is realized, with the hypothesis of
annual balancing. During the year, of course, it is possible that the energy production by renewable
The replacement of diesel buses with hydrogen buses in the province of Trapani represents a
annual balancing. During the year, of course, it is possible that the energy production by renewable
sources could exceed the electrical energy demand of the hydrogen station or on the contrary the
big opportunity to reduce significantly the production of pollutants in urban areas, especially due to
sources could exceed the electrical energy demand of the hydrogen station or on the contrary the
renewable production could be not enough to cover the energy demand. In every case, the role of
public transport. The centralization of the storage and the presence of specialized workers represent
renewable production could be not enough to cover the energy demand. In every case, the role of
other important advantages. The emission factors used in this text are shown in Table 7 [17]. These are:
CO 2 , CO, PM 10 , NMVOC and NO x , expressed in g/km.