
Page 14 - Franzitta_et_alii_2017
P. 14
14 of 19
Sustainability 2017, 9, 106
balancing between electrical energy production and energy consumption by hydrogen station will
be assigned to the electrical grid.
4.2. Avoided Emissions
The replacement of diesel buses with hydrogen buses in the province of Trapani represents a big
opportunity to reduce significantly the production of pollutants in urban areas, especially due to
public transport. The centralization of the storage and the presence of specialized workers represent
other important advantages. The emission factors used in this text are shown in Table 7 [17]. These
Sustainability 2017, 9, 106 14 of 19
are: CO2, CO, PM10, NMVOC and NOx, expressed in g/km.
Table 7. Emission factors used for public transport in the province of Trapani.
Table 7. Emission factors used for public transport in the province of Trapani.
Pollutants Emission Factors [g/km]
Pollutants Emission Factors [g/km]
CO2 1132.797
1132.797
CO 2 5.992
CO
CO 5.992
PM10 0.879
PM 10 0.879
NMVOC 1.642 1.642
NMVOC
NO x 17.927
NOx 17.927
The avoided emissions are obtained by multiplying these emissions factors by the kilometers
The avoided emissions are obtained by multiplying these emissions factors by the kilometers
covered by the diesel buses in every scenario. Obviously, the biggest item is represented by CO 2 , but
covered by the diesel buses in every scenario. Obviously, the biggest item is represented by CO2, but
the avoided emissions of the other pollutants have also an important role in order to reduce global
the avoided emissions of the other pollutants have also an important role in order to reduce global
warming [24].
warming [24].
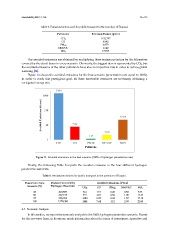
Figure 14 shows the avoided emissions for the best scenario (penetration rate equal to 100%). In
Figure 14 shows the avoided emissions for the best scenario (penetration rate equal to 100%).
order to reach this prestigious goal, all three renewable resources are necessary, obtaining
In order to reach this prestigious goal, all three renewable resources are necessary, obtaining a a
variegated energy mix.
variegated energy mix.
Figure 14. Avoided emissions in the best scenario (100% of hydrogen penetration rate).
Figure 14. Avoided emissions in the best scenario (100% of hydrogen penetration rate).
Finally, the following Table 8 reports the avoided emission in the four different hydrogen
Finally, the following Table 8 reports the avoided emission in the four different hydrogen
penetration scenarios.
penetration scenarios.
Table 8. Avoided emissions for public transport in the province of Trapani.
Penetration Rate Distance Covered by Avoided Emissions [t/Year]
Scenario [%] Hydrogen Fleet [km]
CO 2 CO PM 10 NMVOC NO x
25 318,587 361 1.91 0.28 0.52 5.71
50 637,175 722 3.82 0.56 1.05 11.42
75 955,762 1083 5.73 0.84 1.57 17.13
100 1,274,350 1444 7.64 1.12 2.09 22.85
4.3. Economic Analysis
In this section, we report the economic analysis in the 100% hydrogen penetration scenario. Except
for the sea wave farm, in literature, much information about the items of investment, operative and