
Page 5 - Geraci_al_2004
P. 5
141
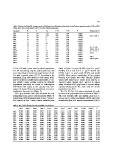
Table 3. Number of alleles (N), Average number of alleles per locus (A) and per polymorphic locus (Ap); average polymorphism P95 and P99,
Wright index (F) and unbalanced loci for 16 wild Brassica populations.
Population N A Ap P 95 P 99 F Unbalanced loci
pop1 19 1.72 2.33 0.36 0.54 20.0285
pop2
pop3 19 1.72 2.14 0.63 0.63 0.0056 Pgi-2, Pgm-1
pop4
pop5 17 1.54 2 0.54 0.54 20.1203
pop6
pop7 16 1.45 2 0.36 0.36 0.3187
pop8
pop9 13 1.19 2 0.18 0.18 20.0394
pop10
pop11 17 1.54 2.5 0.36 0.36 20.1025
pop12
pop13 18 1.63 2 0.54 0.63 0.0747
pop14
pop15 17 1.54 2 0.45 0.54 0.0495 Aco-3, Lap-1
pop16
17 1.54 2 0.45 0.54 20.2095 Pgm-2, Aco-4
17 1.54 2.5 0.36 0.36 20.0702 Aco-3, Lap-1
17 1.54 2.5 0.36 0.36 20.1875 Aco-3
17 1.54 2.5 0.36 0.36 20.1697
19 1.63 2.6 0.45 0.45 0.0853 Lap-1
19 1.63 2.14 0.63 0.63 0.1273 Pgi-2, Pgm-2
16 1.45 2 0.36 0.45 20.0887
17 1.54 2.33 0.36 0.36 20.2159
1.19 to 1.72 with a mean value for all the populations found at Pgm-1 in pop6 (0.592), Pgm-2 in pop11
of 1.54. Considering only the polymorphic loci, this (0.580), Aco-2 and Aco-3 in pop13 (0.530 and
mean value (Ap) increased and ranged between 2 and 0.522), Lap-1 in pop1, pop2 (0.625) and pop10
2.6, with a general mean of 2.22. According to the (0.656). Mean values, considering all loci ranged
population, from 18% (pop5) to 63% (pop2, pop7, between 0.24 (pop2) and 0.067 (pop12). Highest
pop14) of the loci studied were polymorphic. F val- values were found for B. incana (0.23, pop14), B.
ues, Wrigth’s index, resulted negative for different rupestris subsp. hispida (0.21, pop13), B. villosa
populations indicating an excess of heterozygous subsp. bivoniana (0.21, pop3) and B. rupestris subsp.
individuals with respect to the expected rate. Chi- rupestris (0.20, pop7). The mean value for all the
square test showed that seven populations were not in populations was 0.16.
equilibrium for some loci (Table 3).
The Ht, Hs, Dst, Gst values calculated for each
Nei’s gene diversity index (H) calculated for each species for the polymorphic loci are shown in Table 5.
polymorphic locus and for each population (Table 4) The total diversity (Ht) was slightly greater in B.
varied from 0.056 (pop8 and pop9) at Pgm-1 locus to incana and B. villosa populations (0.338 and 0.391
0.65 (pop10) at Lap-1 locus. Greater variability was respectively) than in B. rupestris populations (0.287).
Table 4. Nei (1973) diversity for each population at each locus.
Pgi-2 Pgm-3 Pgm-1 Pgm-2 Aco-1 Aco-2 Aco-3 Aco-4 Lap-1 6 Pgd1 6Pgd-2 H
pop1 0.000 0.000 0.000 0.082 0.249 0.058 0.157 0.245 0.625 0.000 0.000 0.129
pop2 0.385 0.000 0.499 0.180 0.180 0.408 0.000 0.395 0.625 0.000 0.000 0.243
pop3 0.000 0.000 0.000 0.489 0.402 0.251 0.493 0.472 0.229 0.000 0.000 0.212
pop4 0.000 0.000 0.499 0.180 0.485 0.225 0.000 0.000 0.498 0.000 0.000 0.171
pop5 0.000 0.000 0.000 0.500 0.000 0.490 0.000 0.000 0.000 0.000 0.000 0.090
pop6 0.000 0.000 0.592 0.000 0.000 0.000 0.478 0.320 0.320 0.000 0.000 0.155
pop7 0.000 0.134 0.000 0.000 0.082 0.395 0.459 0.245 0.490 0.480 0.000 0.208
pop8 0.202 0.000 0.056 0.000 0.000 0.490 0.498 0.303 0.224 0.000 0.000 0.161
pop9 0.000 0.000 0.056 0.132 0.000 0.499 0.490 0.498 0.473 0.000 0.000 0.195
pop10 0.000 0.000 0.395 0.000 0.132 0.000 0.498 0.000 0.656 0.000 0.000 0.153
pop11 0.000 0.000 0.474 0.580 0.000 0.000 0.451 0.000 0.083 0.000 0.000 0.144
pop12 0.000 0.000 0.083 0.000 0.000 0.000 0.108 0.157 0.385 0.000 0.000 0.067
pop13 0.000 0.000 0.000 0.000 0.467 0.530 0.522 0.395 0.397 0.000 0.000 0.210
pop14 0.474 0.000 0.000 0.532 0.000 0.000 0.500 0.155 0.133 0.490 0.303 0.235
pop15 0.000 0.000 0.285 0.180 0.000 0.056 0.000 0.000 0.082 0.420 0.000 0.093
pop16 0.000 0.000 0.000 0.407 0.000 0.368 0.000 0.084 0.292 0.000 0.000 0.105