
Page 31 - Invasive_Species_2013
P. 31
Monitoring invasive algae
For each different habitat, the coverage of invasive algae
may be quantified by using 25 cm x 25 cm quadrats, each
subdivided into 25 subquadrats of 5 cm x 5 cm (Cebrian
et al., 2000; Fig. 13). In each habitat type, divers position
2
20 quadrats (covering a total area of 1.25 m ) randomly
over the substrate and record the number of subquadrats
in which the specific invasive alga occurs.
Monitoring sessile invertebrates and
species with scattered distribution
Bathymetric transects performed in different habitats at
each sampling station may firstly identify the depth at
which other invasive species are most abundant. At each
depth, two transects (50 m x 1 m) located randomly
should be monitored by a scuba-diving team. In those
cases where invasive species may be of a considerable
size (e.g. the invasive coral Oculina patagonica), only
colonies or individuals with at least 50% of their surface
area lying within the belt transect should be considered
and counted to avoid bias in the sampling (Nugues and
Roberts, 2003).
Monitoring invasive fishes
At each sampling station, the abundance and size of any
invasive fish should be recorded along transects. An
observer should dive at an approximately constant speed
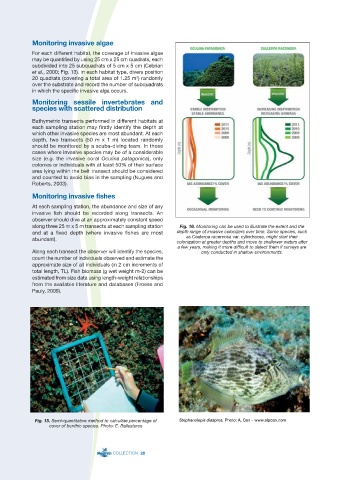
along three 25 m x 5 m transects at each sampling station Fig. 16. Monitoring can be used to illustrate the extent and the
and at a fixed depth (where invasive fishes are most depth range of invasive colonizers over time. Some species, such
as Caulerpa racemosa var. cylindracea, might start their
abundant).
colonization at greater depths and move to shallower waters after
a few years, making it more difficult to detect them if surveys are
Along each transect the observer will identify the species, only conducted in shallow environments.
count the number of individuals observed and estimate the
approximate size of all individuals (in 2 cm increments of
total length, TL). Fish biomass (g wet weight m-2) can be
estimated from size data using length-weight relationships
from the available literature and databases (Froese and
Pauly, 2009).
Fig. 15. Semi-quantitative method to calculate percentage of Stephanolepis diaspros. Photo: A. Can – www.alpcan.com
cover of benthic species. Photo: E. Ballesteros
COLLECTION 28