
Page 3 - Marrone_alii_2013
P. 3
Author's personal copy
Zoomorphology
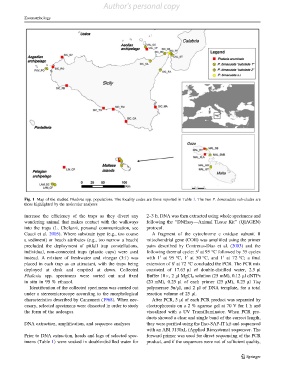
Fig. 1 Map of the studied Phaleria spp. populations. The locality codes are those reported in Table 1. The two P. bimaculata sub-clades are
those highlighted by the molecular analyses
increase the efficiency of the traps as they divert any 2–3 h. DNA was then extracted using whole specimens and
wandering animal that makes contact with the walkways following the ‘‘DNEasy—Animal Tissue Kit’’ (QIAGEN)
into the traps (L. Chelazzi, personal communication, see protocol.
Gauci et al. 2005). Where substrate type (e.g., too coarse A fragment of the cytochrome c oxidase subunit II
a sediment) or beach attributes (e.g., too narrow a beach) mitochondrial gene (COII) was amplified using the primer
precluded the deployment of pitfall trap constellations, pairs described by Contreras-Diaz et al. (2003) and the
0
individual, non-connected traps (plastic cups) were used following thermal cycle: 5 at 95 °C followed by 35 cycles
0
0
0
instead. A mixture of freshwater and vinegar (3:1) was with 1 at 95 °C, 1 at 50 °C, and 1 at 72 °C; a final
0
placed in each trap as an attractant, with the traps being extension of 8 at 72 °C concluded the PCR. The PCR mix
deployed at dusk and emptied at dawn. Collected consisted of 17.63 ll of double-distilled water, 2.5 ll
Phaleria spp. specimens were sorted out and fixed Buffer 109,2 ll MgCl 2 solution (25 mM), 0.12 ll dNTPs
in situ in 95 % ethanol. (20 mM), 0.25 ll of each primer (25 lM), 0.25 ll Taq
Identification of the collected specimens was carried out polymerase 5u/ll, and 2 ll of DNA template, for a total
under a stereomicroscope according to the morphological reaction volume of 25 ll.
characteristics described by Canzoneri (1968). When nec- After PCR, 5 ll of each PCR product was separated by
essary, selected specimens were dissected in order to study electrophoresis on a 2 % agarose gel at 70 V for 1 h and
the form of the aedeagus. visualized with a UV Transilluminator. When PCR pro-
ducts showed a clear and single band of the correct length,
DNA extraction, amplification, and sequence analyses they were purified using the Exo-SAP-IT kit and sequenced
with an ABI 3130xL (Applied Biosystems) sequencer. The
Prior to DNA extraction, heads and legs of selected spec- forward primer was used for direct sequencing of the PCR
imens (Table 1) were soaked in double-distilled water for product, and if the sequences were not of sufficient quality,
123