
Page 6 - Marrone_alii_2013
P. 6
Author's personal copy
Zoomorphology
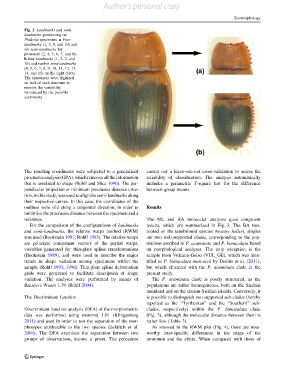
Fig. 2 Landmarks and semi-
landmarks positioning on
Phaleria specimens. a Four
landmarks (1, 3, 9, and 10) and
six semi-landmarks for
pronotum (2, 4, 5, 6, 7, and 8);
b four landmarks (1, 2, 3, and
16) and twelve semi-landmarks
(4, 5, 6, 7, 8, 9, 10, 11, 12, 13,
14, and 15) on the right elytra.
The landmarks were digitized
on half of each structure to
remove the variability
introduced by the possible
asymmetry
The resulting coordinates were subjected to a generalized carries out a leave-one-out cross-validation to assess the
procrustes analysis (GPA), which removes all the information reliability of classification. The analysis automatically
that is unrelated to shape (Rohlf and Slice 1990). The per- includes a parametric T-square test for the difference
pendicular projection or minimum procrustes distance crite- between group means.
rion, in this study, was used to align the semi-landmarks along
their respective curves. In this case, the coordinates of the
outlines were slid along a tangential direction, in order to Results
minimize the procrustes distance between the specimen and a
reference. The ML and BA molecular analyses gave congruent
For the comparison of the configurations of landmarks results, which are summarized in Fig. 3. The BA tree,
and semi-landmarks, the relative warps method (RWM) rooted on the tenebrionid species Nesotes helleri, singles
was used (Bookstein 1991; Rohlf 1993). The relative warps out two well-supported clades, corresponding to the pop-
are principal component vectors of the partial warps, ulations ascribed to P. acuminata and P. bimaculata based
variables generated for thin-plate spline transformations on morphological analyses. The only exception is the
(Bookstein 1989), and were used to describe the major sample from Vulcano-Gelso (VUL_GE), which was iden-
trends in shape variation among specimens within the tified as P. bimaculata marcuzzii by Deidun et al. (2011),
sample (Rohlf 1993, 1996). Thin-plate spline deformation but which clustered with the P. acuminata clade in the
grids were generated to facilitate description of shape present study.
variation. The analyses were performed by means of The P. acuminata clade is poorly structured, as the
RELATIVE WARPS 1.39 (Rohlf 2004). populations are rather homogeneous, both on the Sicilian
mainland and on the circum-Sicilian islands. Conversely, it
The Discriminant function is possible to distinguish two supported sub-clades (hereby
reported as the ‘‘Tyrrhenian’’ and the ‘‘Southern’’ sub-
Discriminant function analysis (DFA) of the morphometric clades, respectively) within the P. bimaculata clade
data was performed using mORPHOj 1.01 (Klingenberg (Fig. 3), although the molecular distance between them is
2011) and used in order to test the separation of the mor- rather low (Table 3).
photypes attributable to the two species (Zelditch et al. As stressed in the RWM plot (Fig. 4), there are note-
2004). The DFA examines the separation between two worthy inter-specific differences in the shape of the
groups of observations, known a priori. The procedure pronotum and the elytra. When compared with those of
123