
Page 6 - Pasanisi_alii_2015
P. 6
Wave climate and coastal
hydrodynamics investigation
Incident offshore wave climate,
nearshore wave conditions and Research & development
wave-induced coastal circulation
at study areas were investigated
using available wave data and
mathematical models.
The offshore wave climate was
derived from historical data
measured from July 1989 to
March 2008 at Mazara del Vallo
recording station of the Italian
Sea Wave Measurement Network
[25]. Wave data were transferred
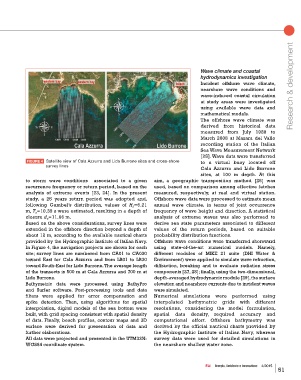
FIGURE 4 Satellite view of Cala Azzurra and Lido Burrone sites and cross-shore to a virtual buoy located off
survey lines
Cala Azzurra and Lido Burrone
sites, at 100 m depth. At this
to storm wave conditions associated to a given aim, a geographic transposition method [26] was
recurrence frequency or return period, based on the used, based on comparison among effective fetches
analysis of extreme events [23, 24]. In the present measured, respectively, at real and virtual station.
study, a 25 years return period was adopted and, Offshore wave data were processed to estimate mean
following Gumbel’s distribution, values of H s =6.21 annual wave climate, in terms of joint occurrence
m, T s =10.39 s were estimated, resulting in a depth of frequency of wave height and direction. A statistical
closure d c =11.66 m. analysis of extreme waves was also performed to
Based on the above considerations, survey lines were derive sea state parameters associated to different
extended in the offshore direction beyond a depth of values of the return periods, based on suitable
about 12 m, according to the available nautical charts probability distribution functions.
provided by the Hydrographic Institute of Italian Navy. Offshore wave conditions were transferred shoreward
In Figure 4, the navigation projects are shown for each using state-of-the-art numerical models. Namely,
site; survey lines are numbered from CA01 to CA030 different modules of MIKE 21 suite (DHI Water &
toward East for Cala Azzurra and from LB01 to LB30 Environment) were applied to simulate wave refraction,
toward South-East for Lido Burrone. The average length diffraction, breaking and to evaluate radiation stress
of the transects is 500 m at Cala Azzurra and 700 m at components [27, 28]; finally, using the two-dimensional,
Lido Burrone. depth-averaged hydrodynamic module [29], the surface
Bathymetric data were processed using BathyPro elevation and nearshore currents due to incident waves
and Surfer software. Post-processing tools and data were simulated.
filters were applied for error compensation and Numerical simulations were performed using
spike detection. Then, using algorithms for spatial interpolated bathymetric grids with different
interpolation, digital models of the sea bottom were resolutions, considering the model formulation,
built, with grid spacing consistent with spatial density spatial data density, required accuracy and
of data. Finally, beach profiles, contour maps and 3D computational effort. Offshore bathymetry was
surface were derived for presentation of data and derived by the official nautical charts provided by
further elaborations. the Hydrographic Institute of Italian Navy, whereas
All data were projected and presented in the UTM33N- survey data were used for detailed simulations in
WGS84 coordinate system. the nearshore shallow water zone.
EAI Energia, Ambiente e Innovazione 4/2015
51