
Page 5 - Power_Line_Cataliotti_2012
P. 5
66 IEEE TRANSACTIONS ON POWER DELIVERY, VOL. 27, NO. 1, JANUARY 2012
TABLE I
, AND COEFFICIENTS FOR 25 AND 50 mm ALUMINUM CABLE
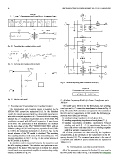
Fig. 12. Trasmitting line coupling interface model.
Fig. 13. Receiving line coupling interface model.
Fig. 15. Medium frequency power transformer model [15].
TABLE II
PARAMETERS FOR LEAKAGE IMPEDANCE
Fig. 14. Interface card model.
D. Medium Frequency Model of a Power Transformer up to
100 kHz
C. Receiving and Transmitting Line Coupling Interface The model up to 100 kHz for the three-phase, two-winding,
core-type and connection transformer is shown in Fig. 15
The transmission and reception signal is supplied by the
[15]. The nodes ABC and abcn correspond to the terminals at
ST7540 FSK power-line transceiver [13]. In the Simulink
the MV and LV, respectively. In this model, the following pa-
model, the signal was generated by a sinusoidal signal gener-
rameters were taken into account:
ator with an output impedance of 5 connected to the coupling
1) winding leakage impedance of each phase ( );
network by a 1:1 isolation transformer and a 50-Hz filter. The
2) winding magnetizing impedance of each phase ( );
modulator can work with different frequencies. It was chosen
3) winding capacitances including: capacitances between
as 86 kHz. The parameters of this transformer are deduced
winding and earth ( , ); capacitances between the
by the data sheet of the VAC T60403-K5024-X044 with an
inner side of MV and outer side of LV windings together
isolation voltage of 6 kV and frequency operation from 10 kHz
with their parasitic components ( , ).
to 1 MHz; the inductance presented is 1.4 mH. In Fig. 12, the
All of these parameters are determined by the impedance
circuit scheme of the TX model is sketched. The receiving
measurements at the terminals of the transformer in the fre-
line coupling interface is the same as the transmitting one. The
quency domain [14]. The measured parameters in the case of
internal impedance is 320 . In Fig. 13, the circuit scheme of
a 160-kVA and 20/0.4-kV power transformer are reported in
the RX model is sketched.
Tables II–IV.
An interface card is connected between the transceiver and
the MV coupling network. The interface card performs an am-
plification of the signal. This operation is realized by a simple IV. EXPERIMENTAL AND SIMULATION RESULTS
circuit based on an operational amplifier in noninverting config- All of the parameters, measured in Section III, were used in
uration, as shown in Fig. 14. the MV power-line model of Fig. 6 to simulate the Favignana