
Page 6 - Power_Line_Cataliotti_2012
P. 6
CATALIOTTI et al.: PLC IN MV SYSTEM 67
TABLE III TABLE V
PARAMETERS FOR MAGNETIZING IMPEDANCE EXPERIMENTAL RESULTS OBTAINED IN THE TESTS PERFORMED
IN THE MV NETWORK OF FAVIGNANA ISLAND
TABLE IV
WINDING CAPACITANCES AND PARASSITIC COMPONENTS
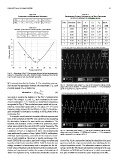
Fig. 16. Attenuation of the PLC transmission between the two transformer sub-
stations: a comparison between the Simulink model (continuous line) and the
experimental measurements (marked with asterisks).
MV network described in Section II. The simulation was car-
ried out and the attenuation between the transmitted ( ) and Fig. 17. Waveform of the voltage and its FFT, measured with the oscillo-
scope in the case of Baudrate 1200 b/s and Deviation 1. The transmitted
received signals ( ), defined as signal corresponds to a sequence of bit 0.
attenuation (4)
was used to analyze the behavior of the PLC communication
model. The voltages and were evaluated at the trans-
ceiver terminals ( , , , ) of the two transformer substations,
as reported in Fig. 6. The simulations were carried out by con-
sidering a sinusoidal signal with an rms value of 1.7 V and a
frequency range between 83 and 90 kHz. In Fig. 16, the attenu-
ation evaluated in simulation according to (4) is plotted with a
continuous line.
To verify the model simulation results, different experimental
tests, in the presence of the MV, were carried out by measuring
the attenuation between the two transformer substations. The
baudrate and deviation of the ST7540 FSK power-line trans-
ceiver were varied in the case of 86-kHz carrier frequency. The
tests were performed by transmitting a signal correspondent to
a sequence of bit 1 or a sequence of bit 0. The measurements Fig. 18. Waveform of the voltage and its FFT, measured with the oscillo-
scope in the case of Baudrate 1200 b/s and Deviation 1. The transmitted
were performed by means of two Agilent 34401A multimeters,
signal corresponds to a sequence of bit 1.
with high input impedance, connected at the transceiver termi-
nals of each substation. Moreover, a digital oscilloscope Tek-
tronix TDS7254B was used to acquire the voltage waveform and seen in Fig. 16, the attenuation obtained in simulation is in good
to perform fast Fourier transform (FFT). Table V shows the rms agreement with the experimental results, thus validating the de-
voltage measured in transmission and in reception for the dif- veloped simulation model. The attenuation assumes values be-
ferent values of baudrate and deviation. In order to compare sim- tween 2 and 6 dB. The largest attenuation is obtained in the case
ulation and experimental results, the measured attenuations of of Baudrate 2400 b/s and Deviation 1, which corresponds
Table V are reported in Fig. 16 by means of asterisks. As can be to a span of 2400 Hz around the center frequency of 86 kHz.