
Page 8 - Shell_growth_2008
P. 8
316 Geo-Mar Lett (2008) 28:309–325
Table 5 Means (±1 SE) of salinities (practical salinity units) and the mid-season months of August, November, February and
oxygen isotopes in seawater samples taken monthly at the three study
May, three shells collected each month. The shells from
localities
each month were divided into two categories: those with
18
18
Locality Number of Mean salinity Mean δ O seawater δ O SHELL SSTs giving lower temperature offsets relative
monthly (psu) (‰ VSMOW) to measured SSTs (‘best fit’) and those giving higher
readings
temperature offsets (‘worst fit’), as shown in Tables 8 and
9. For the shells in the ‘best fit’ group, shell isotope SSTs
Cala Grande 24 35.89±0.088 1.18±0.018 2
Monte Cofano 24 35.35±0.077 1.18±0.018 track both local and Palermo station SSTs very well (r =
Mazzaforno 16 35.98±0.091 1.27±0.021 0.979 and 0.987 respectively). The good fit to the mean
monthly Palermo SSTs is confirmed by the lack of
significant difference between paired values in seven of
the 12 months (Table 9). With the exception of April 2005,
18
significant) but this cannot account for the March 2004 δ O SHELL SSTs accord best with measured SSTs during
18
differences. Otherwise, δ O SHELL SSTs significantly un- the colder months of the year. The greatest discrepancies
derestimate recorded local SSTs, except in the months of occur during the summer months, especially July to
January, February and November 2003, and January and September.
February 2004, where there are no significant differences. For the monthly data showing the higher offsets (‘worst
The pattern is slightly different for the comparison with fit’ group), shell isotope temperatures track measured SSTs
2
Palermo mean monthly SSTs (e.g. March, September and quite well (r =0.928 and 0.962), the latter value indicating a
December 2003). For both comparisons, there are large better fit with mean monthly SSTs measured by the
deviations (>3.0°C) for the months of May, June, July and Palermo station, but only in February 2005 is there no
18
August 2003, and July and August 2004, with a particularly significant difference between δ O SHELL SST and mean
high deviation of 8.7°C relative to Palermo in July 2004 monthly SST (Table 9).
(Table 7).
Mazzaforno: effect of shell size
Monthly shell edge values: Mazzaforno
18
δ O SHELL temperatures from larger shells track closely the
2
The association between the SSTs measured at the locality Mazzaforno monthly SST values (r =0.958) and also
18
2
and the δ O SHELL SSTs over the full period of study is Palermo mean monthly SSTs (r =0.951). Similarly,
18
showninFig. 7. From August 2004 to July 2005, δ O SHELL temperatures from smaller shells track well the
18
2
δ O SHELL SSTs were calculated from either two or, for Mazzaforno monthly SST values (r =0.930) and, particu-
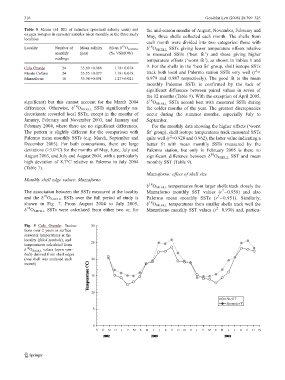
Fig. 5 Cala Grande: fluctua-
tions over 2 years in surface
seawater temperatures at the
locality (filled symbols), and
temperatures calculated from
18
δ O SHELL values (open sym-
bols) derived from shell edges
(one shell was analysed each
month)