Page 9 - Shell_growth_2008
P. 9

Geo-Mar Lett (2008) 28:309–325                                                                  317

           Table 6 Cala Grande isotope and temperature (°C) data
                             18
           Month        Edge δ O SHELL  Calculated  Mean SST      Difference, between  Mean monthly  Difference between
                                       18
                        value (‰ VPDB)  δ O SHELL   measured at the  measured SST  SST at Mazara  mean monthly SST at
                                                                      18
                                      temperature (°C)  time of collection  and δ O SHELL  del Vallo (°C)  Mazara del Vallo and
                                                                                               18
                                                    (°C)          temperature (°C)            δ O SHELL temperature
           November 2002    +0.84          20.9          20.4         −0.5 ns        18.7          −2.2
           December 2002    +2.15          15.2          16.8         +1.6           16.2          +1.0
           January 2003     +2.32          14.5          15.9         +1.4           15.5          +1.0
           February 2003    +2.80          12.4          15.1         +2.7           14.4          +2.0
           March 2003       +2.62          13.2          15.0         +1.8           14.6          +1.4
           April 2003       +2.25          14.8          16.0         +1.2           15.6          +0.8 ns
           May 2003         +1.34          18.7          18.8         +0.1 ns        17.5          −1.2
           June 2003        +1.21          19.3          19.6         +0.3 ns        21.2          +1.9
           July 2003        +0.55          22.2          25.0         +2.8           23.3          +1.1
           August 2003      +0.50          22.4          24.7         +2.3           25.3          +2.9
           September 2003   +0.21          23.7          25.9         +2.2           24.1          +0.4 ns
           October 2003     +1.16          19.5          21.9         +2.4           22.6          +3.1
           November 2003    +1.23          19.2          19.5         +0.3 ns        20.1          +0.9
           December 2003    +1.27          19.0          18.9         −0.1 ns        17.2          −1.8
           January 2004     +2.11          15.4          14.5         −0.9           14.9          −0.5 ns
           February 2004    +2.37          14.2          14.9         +0.7 ns        14.4          +0.2 ns
           March 2004       +2.42          14.0          14.9         +0.9           14.6          +0.6 ns
           April 2004       +2.69          12.9          15.5         +2.6           15.3          +2.4
           May 2004         +2.31          14.5          16.9         +2.4           17.3          +2.8
           June 2004        +1.93          16.2          19.7         +3.5           19.9          +3.7
           July 2004        +0.92          20.6          20.6          0.0 ns        22.1          +1.5
           August 2004      +0.28          23.3          24.9         +1.6           23.8          +0.5 ns
           September 2004   +0.36          23.0          25.6         +2.6           23.2          +0.2 ns
           October 2004     +0.47          22.5          23.4         +0.9           21.9          −0.6 ns

           ns Not statistically significant


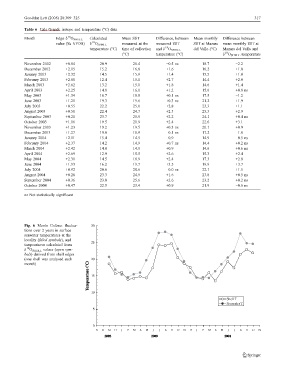
           Fig. 6 Monte Cofano: fluctua-
           tions over 2 years in surface
           seawater temperatures at the
           locality (filled symbols), and
           temperatures calculated from
            18
           δ O SHELL values (open sym-
           bols) derived from shell edges
           (one shell was analysed each
           month)
   4   5   6   7   8   9   10   11   12   13   14