
Page 12 - Shell_growth_2008
P. 12
320 Geo-Mar Lett (2008) 28:309–325
Table 10 Mazzaforno isotope data from ‘large’ and ‘small’ shells relative to SST (°C) data at the locality (MZF) and from the marine station in
the Gulf of Palermo
Month Large shells, Edge Difference between Small shells, Edge Difference between
18
18
18
18
diameter (mm) δ O SHELL SST and δ O SHELL diameter (mm) δ O SHELL SST and δ O SHELL
values in large temperature, large value in temperature, small
shells (‰ VPDB) shells small shells shells
(‰ VPDB)
MZF Palermo MZF Palermo
SST (°C) SST (°C) SST (°C) SST (°C)
August 2004 22.7 −0.02 +3.1 +2.2 20.3 +0.18 +3.9 +3.0
September 2004 20.7 +0.04 +3.1 +0.9 19.8 +0.73 +6.1 +3.9
October 2004 21.1 +0.73 +2.9 +1.8 21.1 +0.73 +2.9 +1.8
November 2004 23.3 +0.97 +0.9 +0.1 ns 21.0 +1.21 +1.9 +1.1
December 2004 22.2 +1.79 +1.3 +0.3 ns 20.7 +1.98 +2.2 +1.2
January 2005 22.3 +2.53 +1.4 +1.0 20.6 +2.45 +1.1 +0.7 ns
February 2005 22.9 +2.62 −0.7 ns +0.1 ns 21.3 +2.53 −1.1 −0.3 ns
March 2005 22.9 +2.97 +0.8 ns +2.2 21.0 +2.59 −0.9 +0.5 ns
April 2005 22.6 +2.95 +3.9 +3.5 20.7 +2.40 +1.5 +1.1
May 2005 22.8 +1.84 +1.7 +2.0 20.3 +1.47 +0.1 ns +0.4 ns
June 2005 22.1 +0.98 +2.9 +2.5 20.4 +0.58 +1.2 +0.8 ns
July 2005 21.5 +0.29 +3.2 +2.8 20.9 +0.09 +2.4 +2.0
Mean 22.3 +1.47 +2.2 +1.6 20.6 +1.41 +2.1 +1.4
ns Not statistically significant
13
cessation some time in the summer. The calculated in O. turbinatus (although discussion of δ C is beyond the
18
δ O SHELL temperatures from this sequence of 24 samples scope of this paper).
range from 13.9°C to 24.6°C, compared with a range of
SSTs at the locality of 14.5°C to 25.6°C over the same Summary of isotope results
period.
13
It should also be noted that variation in δ C in this shell From Tables 6, 7, 8, 9 and 10, it is apparent that monthly
18
appears to be cyclic (Fig. 8), with a significant negative SSTs calculated from δ O SHELL mostly underestimate
13
18
correlation between δ C and δ O values (r=−0.500; p= measured SSTs, the offsets generally being lower in the
13
0.02) suggesting a seasonal influence on variability of δ C cooler months. Comparing the offsets for each locality and
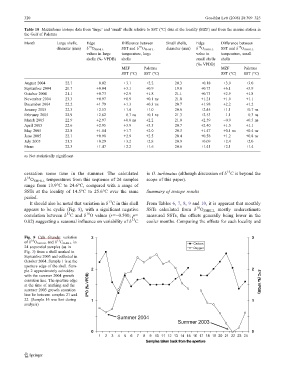
Fig. 8 Cala Grande: variation
13
18
of δ O SHELL and δ C SHELL in
24 sequential samples (as in
Fig. 3) from a shell marked in
September 2003 and collected in
October 2004. Sample 1 is at the
aperture edge of the shell. Sam-
ple 2 approximately coincides
with the summer 2004 growth
cessation line. The aperture edge
at the time of marking and the
summer 2003 growth cessation
line lie between samples 21 and
22. (Sample 16 was lost during
analysis)