
Page 4 - Thunnus_2020
P. 4
www.nature.com/scientificreports/ www.nature.com/scientificreports
LF Weight Estimated δ N vs δ C vs
15
13
ID Label Area (cm) (Kg) age AIR sd PDB sd
Juvenile/Adult 6C C North-western of Sicily 132.0 31.0 N.A. 5.4 0.1 −12.0 0.0
Juvenile/Adult 7C C North-western of Sicily 132.0 35.0 7 year 6.7 — −15.6 —
Juvenile/Adult 8C C North-western of Sicily 135.0 34.0 7 year 5.9 0.0 −13.4 0.3
Juvenile/Adult 9C C North-western of Sicily 137.0 35.0 7 year 7.0 0.0 −14.1 0.1
Juvenile/Adult 10C C North-western of Sicily 137.0 33.0 7 year 10.6 0.0 −13.0 0.1
Juvenile/Adult 11C C North-western of Sicily 138.0 34.0 7 year 6.4 0.2 −12.6 0.0
Juvenile/Adult 12C C North-western of Sicily 139.0 42.0 6 year 6.2 0.0 −12.7 0.1
Juvenile/Adult 13C C North-western of Sicily 142.0 37.0 6 year 6.9 0.0 −12.3 0.0
Juvenile/Adult 14C C North-western of Sicily 143.0 39.0 6 year 7.9 0.0 −12.3 0.0
Juvenile/Adult 15C C North-western of Sicily 144.0 39.0 N.A. 7.3 0.1 −13.2 0.1
Juvenile/Adult 16C C North-western of Sicily 147.0 45.0 6–7 year 7.7 0.1 −13.6 0.0
Juvenile/Adult 17C C North-western of Sicily 148.0 40.0 N.A. 6.3 0.0 −12.7 0.0
Juvenile/Adult 18C C North-western of Sicily 152.0 47.0 N.A. 8.0 0.1 −12.8 0.1
Juvenile/Adult 19C C North-western of Sicily 152.0 58.0 N.A. 10.5 0.1 −13.3 0.0
Juvenile/Adult 20C C North-western of Sicily 153.0 47.0 6–7 year 7.1 0.0 −14.0 0.1
Juvenile/Adult 21C C North-western of Sicily 153.0 47.0 6–7 year 5.3 0.0 −12.4 0.0
Juvenile/Adult 22C C North-western of Sicily 155.0 48.0 7 year 6.6 0.2 −12.6 0.1
Juvenile/Adult 23C C North-western of Sicily 117.0 27.0 5 year 8.6 0.2 −17.6 0.7
Juvenile/Adult 24C C North-western of Sicily 136.0 76.0 7 year 7.8 0.2 −17.3 0.0
Juvenile/Adult 25C C North-western of Sicily 162.0 74.0 6 year 8.4 0.1 −18.4 0.5
Juvenile/Adult 26C C North-western of Sicily 172.0 141.0 10 year 9.9 0.1 −20.1 0.5
Juvenile/Adult 27C C North-western of Sicily 178.0 87.0 9 year 7.4 — −17.8 —
Juvenile/Adult 28C C North-western of Sicily 202.0 138.0 10 year 7.8 0.5 −17.0 0.5
Juvenile/Adult 29C C North-western of Sicily 212.0 170.0 15 year 8.2 — −15.1 —
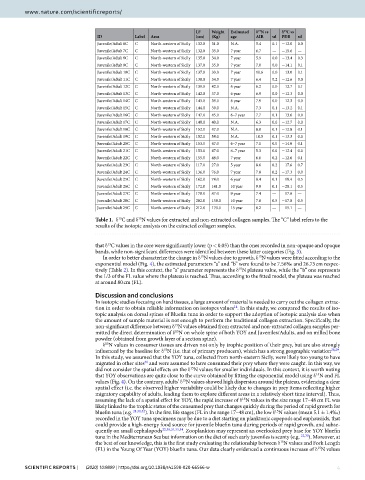
Table 1. δ C and δ N values for extracted and non-extracted collagen samples. T e “C” label refers to the
15
13
results of the isotopic analysis on the extracted collagen samples.
13
that δ C values in the core were signif cantly lower (p < 0.05) than the ones recorded in non-opaque and opaque
bands, while non-signif cant dif erences were identif ed between these latter categories (Fig. 3).
15
In order to better characterize the change in δ N values due to growth, δ N values were f tted according to the
15
exponential model (Fig. 4), the estimated parameters “a” and “b” were found to be 7.56‰ and 26.75 cm respec-
15
tively (Table 2). In this context, the “a” parameter represents the δ N plateau value, while the “b” one represents
the 1/3 of the FL value where the plateau is reached. T us, according to the f tted model, the plateau was reached
at around 80 cm (FL).
Discussion and conclusions
In isotopic studies focusing on hard tissues, a large amount of material is needed to carry out the collagen extrac-
14
tion in order to obtain reliable information on isotopes values . In this study, we compared the results of iso-
topic analysis on dorsal spines of Bluef n tuna in order to support the adoption of isotopic analysis also when
the amount of sample material is not enough to perform the traditional collagen extraction. Specif cally, the
15
non-signif cant dif erence between δ N values obtained from extracted and non-extracted collagen samples per-
15
mitted the direct determination of δ N on whole spine of both YOY and Juveniles/Adults, and on milled bone
powder (obtained from growth layer of a section spine).
δ N values in consumer tissues are driven not only by trophic position of their prey, but are also strongly
15
15
inf uenced by the baseline for δ N (i.e. that of primary producers), which has a strong geographic variation 28,29 .
In this study, we assumed that the YOY tuna, collected from north-eastern Sicily, were likely too young to have
migrated in other sites and were assumed to have consumed their prey where they were caught. In this way, we
30
15
did not consider the spatial ef ects on the δ N values for smaller individuals. In this context, it is worth noting
that YOY observations are quite close to the curve obtained by f tting the exponential model using δ N and FL
15
15
values (Fig. 4). On the contrary, adults’ δ N values showed high dispersion around the plateau, evidencing a clear
spatial ef ect (i.e. the observed higher variability could be likely due to changes in prey items ref ecting higher
migratory capability of adults, leading them to explore dif erent areas in a relatively short time interval). T us,
assuming the lack of a spatial ef ect for YOY, the rapid increase of δ N values in the size range 17–48 cm FL was
15
likely linked to the trophic status of the consumed prey that changes quickly during the period of rapid growth for
15
bluef n tuna (e.g. 21,31,32 ). In the f rst life stages (FL in the range 17–48 cm), the low δ N values (mean 5.1 ± 1.4‰)
recorded in the YOY tuna specimens may be due to a diet starting on planktonic copepods and euphausiids, that
could provide a high-energy food source for juvenile bluef n tuna during periods of rapid growth, and subse-
quently on small cephalopods 22,30,31,33,34 . Zooplankton may represent an overlooked prey base for YOY bluef n
tuna in the Mediterranean Sea but information on the diet of such early juveniles is scanty (e.g. 22,30 ). Moreover, at
15
the best of our knowledge, this is the f rst study evaluating the relationship between δ N values and Fork Length
(FL) in the Young Of Year (YOY) bluef n tuna. Our data clearly evidenced a continuous increase of δ N values
15
Scientific RepoRtS | (2020) 10:9899 | https://doi.org/10.1038/s41598-020-66566-w 4