
Page 5 - Thunnus_2020
P. 5
www.nature.com/scientificreports/ www.nature.com/scientificreports
13
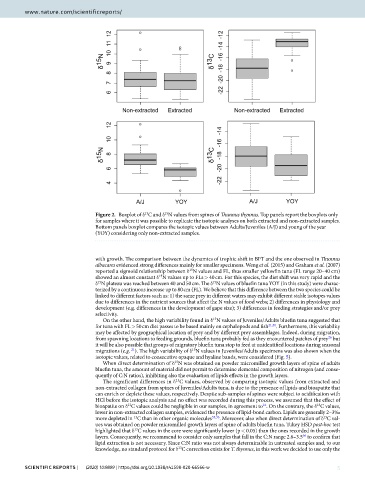
Figure 2. Boxplot of δ C and δ N values from spines of T unnus thynnus. Top panels report the boxplots only
15
for samples where it was possible to replicate the isotopic analyses on both extracted and non-extracted samples.
Bottom panels boxplot compares the isotopic values between Adults/Juveniles (A/J) and young of the year
(YOY) considering only non-extracted samples.
with growth. T e comparison between the dynamics of trophic shif in BFT and the one observed in T unnus
albacares evidenced strong dif erences mainly for smaller specimens. Weng et al. (2015) and Graham et al. (2007)
15
reported a sigmoid relationship between δ N values and FL, thus smaller yellowf n tuna (FL range 20–40 cm)
15
showed an almost constant δ N values up to FLs > 40 cm. For this species, the diet shif was very rapid and the
15
15
δ N plateau was reached between 40 and 50 cm. T e δ N values of bluef n tuna YOY (in this study) were charac-
terized by a continuous increase up to 80 cm (FL). We believe that this dif erence between the two species could be
linked to dif erent factors such as: 1) the same prey in dif erent waters may exhibit dif erent stable isotopes values
due to dif erences in the nutrient sources that af ect the N values of food webs; 2) dif erences in physiology and
development (e.g. dif erences in the development of gape size); 3) dif erences in feeding strategies and/or prey
selectivity.
15
On the other hand, the high variability found in δ N values of Juveniles/Adults bluef n tuna suggested that
for tuna with FL > 50 cm diet passes to be based mainly on cephalopods and f sh 21,30 . Furthermore, this variability
may be af ected by geographical location of prey and by dif erent prey assemblages. Indeed, during migration,
from spawning locations to feeding grounds, bluef n tuna probably fed as they encountered patches of prey but
26
it will be also possible that groups of migratory bluef n tuna stop to feed at unidentif ed locations during seasonal
15
migrations (e.g. ). T e high variability of δ N values in Juveniles/Adults specimens was also shown when the
21
isotopic values, related to consecutive opaque and hyaline bands, were considered (Fig. 5).
When direct determination of δ N was obtained on powder micromilled growth layers of spine of adults
15
bluef n tuna, the amount of material did not permit to determine elemental composition of nitrogen (and conse-
quently of C:N ratios), inhibiting also the evaluation of lipids ef ects in the growth layers.
The significant differences in δ C values, observed by comparing isotopic values from extracted and
13
non-extracted collagen from spines of Juveniles/Adults tuna, is due to the presence of lipids and bioapatite that
can enrich or deplete these values, respectively. Despite sub-samples of spines were subject to acidif cation with
HCl before the isotopic analysis and no ef ect was recorded during this process, we assumed that the ef ect of
13
16
13
bioapatite on δ C values could be negligible in our samples, in agreement to . On the contrary, the δ C values,
lower in non-extracted collagen samples, evidenced the presence of lipid-bond carbon. Lipids are generally 2–3‰
more depleted in C than in other organic molecules 35,36 . Moreover, also when direct determination of δ C val-
13
13
ues was obtained on powder micromilled growth layers of spine of adults bluef n tuna, Tukey HSD post-hoc test
highlighted that δ C values in the core were signif cantly lower (p < 0.05) than the ones recorded in the growth
13
36
layers. Consequently, we recommend to consider only samples that fall in the C:N range 2.6–3.5 to conf rm that
lipid extraction is not necessary. Since C:N ratio was not always determinable in untreated samples and, to our
knowledge, no standard protocol for δ C correction exists for T. thynnus, in this work we decided to use only the
13
Scientific RepoRtS | (2020) 10:9899 | https://doi.org/10.1038/s41598-020-66566-w 5