
Page 7 - Thunnus_2020
P. 7
www.nature.com/scientificreports/ www.nature.com/scientificreports
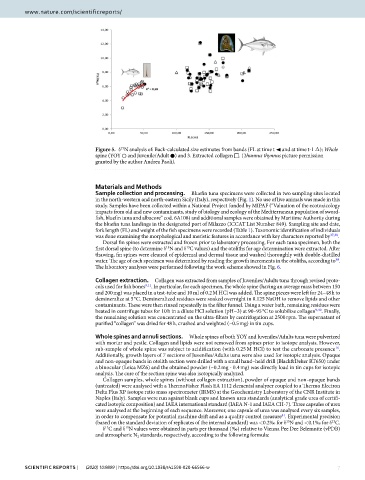
Figure 5. δ N analysis of: Back-calculated size estimates from bands (FL at time t ◄ and at time t-1 Δ); Whole
15
spine (YOY ○ and Juvenile/Adult ●) and 3. Extracted collagen □. (T unnus thynnus picture permission
granted by the author Andrea Paoli).
Materials and Methods
Sample collection and processing. Bluef n tuna specimens were collected in two sampling sites located
in the north-western and north-eastern Sicily (Italy), respectively (Fig. 1). No use of live animals was made in this
study. Samples have been collected within a National Project funded by MIPAF (“Valuation of the ecotoxicology
impacts from old and new contaminants, study of biology and ecology of the Mediterranean population of sword-
f sh, bluef n tuna and albacore” cod. 6A108) and additional samples were obtained by Maritime Authority during
the bluef n tuna landings in the designated port of Milazzo (ICCAT List Number 849). Sampling site and date,
fork length (FL) and weight of the f sh specimens were recorded (Table 1). Taxonomic identif cation of individuals
was done examining the morphological and meristic features in accordance with key characters reported by 37,38 .
Dorsal f n spines were extracted and frozen prior to laboratory processing. For each tuna specimen, both the
13
15
f rst dorsal spine (to determine δ N and δ C values) and the otoliths for age determination were extracted. Af er
thawing, f n spines were cleaned of epidermal and dermal tissue and washed thoroughly with double-distilled
water. T e age of each specimen was determined by reading the growth increments in the otoliths, according to .
39
T e laboratory analyses were performed following the work scheme showed in Fig. 6.
collagen extraction. Collagen was extracted from samples of Juveniles/Adults tuna through revised proto-
cols used for f sh bones 9,11 . In particular, for each specimen, the whole spine (having an average mass between 150
and 200 mg) was placed in a test-tube and 10 ml of 0.2 M HCl was added. T e spine pieces were lef for 24–48 h to
demineralize at 5 °C. Demineralized residues were soaked overnight in 0.125 NaOH to remove lipids and other
contaminants. T ese were then rinsed repeatedly in the f lter funnel. Using a water bath, remaining residues were
heated in centrifuge tubes for 10 h in a dilute HCl solution (pH~3) at 90–95 °C to solubilize collagen 9,40 . Finally,
the remaining solution was concentrated on the ultra-f lters by centrifugation at 2500 rpm. T e supernatant of
purif ed “collagen” was dried for 48 h, crushed and weighted (~0.5 mg) in tin cups.
Whole spines and annuli sections. Whole spines of both YOY and Juveniles/Adults tuna were pulverized
with mortar and pestle. Collagen and lipids were not removed from spines prior to isotope analysis. However,
sub-sample of whole spine was subject to acidification (with 0.25 M HCl) to test the carbonate presence .
16
Additionally, growth layers of 7 sections of Juveniles/Adults tuna were also used for isotopic analysis. Opaque
and non-opaque bands in otolith section were drilled with a small hand–held drill (Black&Deker RT650) under
a binocular (Leica MZ6) and the obtained powder (~0.2 mg - 0.4 mg) was directly load in tin cups for isotopic
analysis. T e core of the section spine was also isotopically analyzed.
Collagen samples, whole spines (without collagen extraction), powder of opaque and non-opaque bands
(untreated) were analysed with a T ermoFisher Flash EA 1112 elemental analyzer coupled to a T ermo Electron
Delta Plus XP isotope ratio mass spectrometer (IRMS) at the Geochemistry Laboratory of the CNR Institute in
Naples (Italy). Samples were run against blank cups and known urea standards (analytical grade urea of certif -
cated isotopic composition) and IAEA international standard (IAEA N-1 and IAEA CH-7). T ree capsules of urea
were analysed at the beginning of each sequence. Moreover, one capsule of urea was analysed every six samples,
41
in order to compensate for potential machine drif and as a quality control measure . Experimental precision
(based on the standard deviation of replicates of the internal standard) was <0.2‰ for δ N and <0.1‰ for δ C.
13
15
δ C and δ N values were obtained in parts per thousand (‰) relative to Vienna Pee Dee Belemnite (vPDB)
13
15
and atmospheric N 2 standards, respectively, according to the following formula:
Scientific RepoRtS | (2020) 10:9899 | https://doi.org/10.1038/s41598-020-66566-w 7