
Page 8 - Thunnus_2020
P. 8
www.nature.com/scientificreports/ www.nature.com/scientificreports
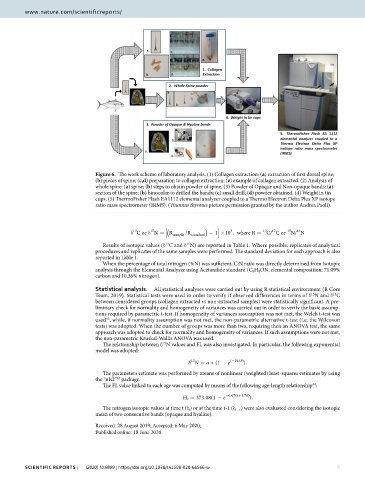
Figure 6. T e work scheme of laboratory analysis. (1) Collagen extraction: (a) extraction of f rst dorsal spine;
(b) pieces of spine; (c,d) preparation to collagen extraction; (e) example of collagen extracted. (2) Analysis of
whole spine: (a) spine; (b) steps to obtain powder of spine. (3) Powder of Opaque and Non-opaque bands: (a)
section of the spine; (b) binocular to drilled the bands; (c) small drill; (d) powder obtained. (4) Weight in tin
cups. (5) T ermoFisher Flash EA1112 elemental analyzer coupled to a T ermo Electron Delta Plus XP isotope
ratio mass spectrometer (IRMS). (T unnus thynnus picture permission granted by the author Andrea Paoli).
3
13
15
12
15
14
13
δ Cor δ N = R /R standard ) − 1 ×10 ,where R = C/C or N/ N
( sample
Results of isotopic values (δ C and δ N) are reported in Table 1. Where possible, replicates of analytical
13
15
procedures and replicates of the same samples were performed. T e standard deviation for each approach is also
reported in Table 1.
When the percentage of total nitrogen (%N) was suf cient, C:N ratio was directly determined from isotopic
analysis through the Elemental Analyzer using Acetanilide standard (C 8 H 9 ON, elemental composition: 71.09%
carbon and 10.36% nitrogen).
Statistical analysis. All statistical analyses were carried out by using R statistical environment (R Core
13
Team, 2019). Statistical tests were used in order to verify if observed differences in terms of δ N and δ C
15
between considered groups (collagen extracted vs non-extracted samples) were statistically signif cant. A pre-
liminary check for normality and homogeneity of variances was carried out in order to verify the basic assump-
tions required by parametric t-test. If homogeneity of variances assumption was not met, the Welch t-test was
used , while, if normality assumption was not met, the non-parametric alternative t-test (i.e. the Wilcoxon
42
tests) was adopted. When the number of groups was more than two, requiring then an ANOVA test, the same
approach was adopted to check for normality and homogeneity of variances. If such assumptions were not met,
the non-parametric Kruskal-Wallis ANOVA was used.
T e relationship between δ N values and FL was also investigated. In particular, the following exponential
15
model was adopted:
15
δ N = a ∗ (1 − e ( −FL b/ ) . )
T e parameters estimate was performed by means of nonlinear (weighted) least-squares estimates by using
43
the “nls2” package.
44
T e FL value linked to each age was computed by means of the following age-length relationship :
FL = 373 .08(1 − e −.0 07( t +.1 76) . )
T e nitrogen isotopic values at time t (δ t ) or at the time t-1 (δ t−1 ) were also evaluated considering the isotopic
mean of two consecutive bands (opaque and hyaline).
Received: 28 August 2019; Accepted: 6 May 2020;
Published: xx xx xxxx
Scientific RepoRtS | (2020) 10:9899 | https://doi.org/10.1038/s41598-020-66566-w 8