
Page 17 - Water-energy_2020
P. 17
F. Calise, et al. Energy Conversion and Management 220 (2020) 113043
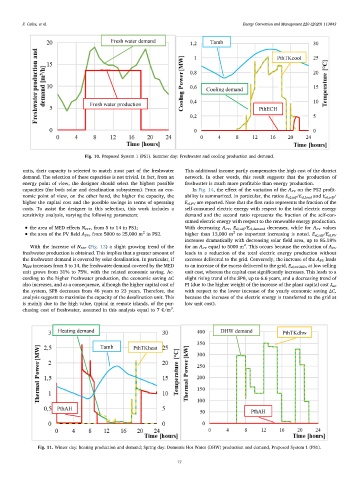
Fig. 10. Proposed System 1 (PS1). Summer day: Freshwater and cooling production and demand.
units, their capacity is selected to match most part of the freshwater This additional income partly compensates the high cost of the district
demand. The selection of these capacities is not trivial. In fact, from an network. In other words, this result suggests that the production of
energy point of view, the designer should select the highest possible freshwater is much more profitable than energy production.
capacities (for both solar and desalination subsystems). From an eco- In Fig. 14, the effect of the variation of the A PV on the PS2 profit-
nomic point of view, on the other hand, the higher the capacity, the ability is summarized. In particular, the ratios E el,self /E el,load and E el,self /
higher the capital cost and the possible savings in terms of operating E el,PV are reported. Note that the first ratio represents the fraction of the
costs. To assist the designer in this selection, this work includes a self-consumed electric energy with respect to the total electric energy
sensitivity analysis, varying the following parameters: demand and the second ratio represents the fraction of the self-con-
sumed electric energy with respect to the renewable energy production.
• the area of MED effects N EFF , from 5 to 14 in PS1; With decreasing A PV , E el,self /E el,demand decreases, while for A PV values
• the area of the PV field A PV , from 5000 to 25,000 m in PS2. higher than 13,000 m no important increasing is noted. E el,self /E el,PV
2
2
increases dramatically with decreasing solar field area, up to 85.18%
2
With the increase of N EFF (Fig. 13) a slight growing trend of the for an A PV equal to 5000 m . This occurs because the reduction of A PV
freshwater production is obtained. This implies that a greater amount of leads to a reduction of the total electric energy production without
the freshwater demand is covered by solar desalination. In particular, if excesses delivered to the grid. Conversely, the increase of the A PV leads
N EFF increases from 5 to 14, the freshwater demand covered by the MED to an increase of the excess delivered to the grid, E el,toGRID , at low selling
unit grows from 31% to 75%. with the related economic saving. Ac- unit cost, whereas the capital cost significantly increases. This leads to a
cording to the higher freshwater production, the economic saving ΔC slight rising trend of the SPB, up to 6.6 years, and a decreasing trend of
also increases, and as a consequence, although the higher capital cost of PI (due to the higher weight of the increase of the plant capital cost J tot
the system, SPB decreases from 46 years to 23 years. Therefore, the with respect to the lower increase of the yearly economic saving ΔC,
analysis suggests to maximize the capacity of the desalination unit. This because the increase of the electric energy is transferred to the grid at
is mainly due to the high value, typical in remote islands, of the pur- low unit cost).
3
chasing cost of freshwater, assumed in this analysis equal to 7 €/m .
Fig. 11. Winter day: heating production and demand; Spring day: Domestic Hot Water (DHW) production and demand, Proposed System 1 (PS1).
17