
Page 13 - Water-energy_2020
P. 13
F. Calise, et al. Energy Conversion and Management 220 (2020) 113043
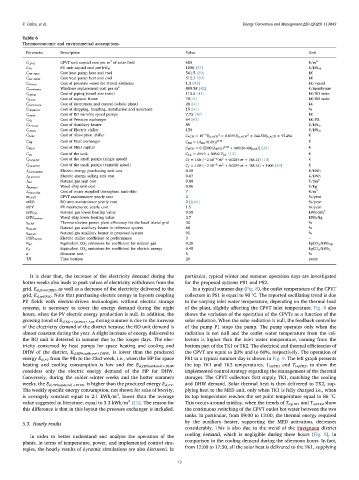
Table 6
Thermoeconomic and environmental assumptions.
Parameter Description Value Unit
2
C CPVT CPVT unit capital cost per m of solar field 600 €/m 2
1000 [37]
C PV PV unit capital cost per kW el €/kW el
Cost heat pump heat and cool 541.5 [39] k€
C HP H&C
Cost heat pump heat and cool 512.7 [39] k€
C HP DHW
Cost of pressure vessel for 8-inch elements 1.2 [41] k€/vessel
C PrVess
2
C membrane Windows replacement cost per m 889.58 [42] €/membrane
Cost of piping (small size train) 113.5 [41] k€/RO train
C piping
C frame Cost of support frame 70[41] k€/RO train
Cost of instrument and control (whole plant) 28 [41] k€
C instrument
C ship&inst Cost of shipping, handling, installation and insurance 15 [41] %
Cost of RO variable speed pumps 7.75 [10] k€
C pump
Cost of Pressure exchanger 64 [43] k€/PX
C PX
C AH,aux Cost of Auxiliary heater 89 €/kW th
Cost of Electric chiller 150
C chiller €/kW th
−5
C ACH Cost of Absorption chiller C ACH = 10 P th ACH, 3 − 0.0393P th ACH, 2 + 244.53P th ACH, + 95.494 €
Cost of Heat exchanger 0.75 €
C HE C HE = A( HE /0.093)
C MED Cost of MED capital A ) 0.95 + 800(86.4 )] [25] €
C MED = 0.5[300( MED M fresh
V
C TK Cost of the tank C TK = 494.9 + 808.0· TK [13] €
Cost of the small pumps (single speed) −8 2 €
C pumpsSS C P = 1.08·( −2·10 · ̇ m + 0.0285· ̇ m + 388.14) [10]
Cost of the small pumps (variable speed) −8 2 €
C pumpsVS C P = 1.08·( −2·10 · ̇ m + 0.0285· ̇ m + 388.14) + 1000 [10]
J el,fromGRID Electric energy purchasing unit cost 0.18 €/kWh
Electric energy selling unit cost 0.07 €/kWh
J el,toGRID
J NG Natural gas unit cost 0.88 €/Sm 3
Wood chip unit cost 0.06 €/kg
J biomass
Cost of water supplied throughout tank-ship 7 €/m 3
J water,ship
m CPVT CPVT maintenance yearly cost 2 %/year
mRO RO unit maintenance yearly cost 2 [8,44] %/year
mPV PV maintenance yearly cost 1.5 %/year
Natural gas lower heating value 9.59 kWh/Sm 3
LHV NG
LHV biomass Wood chip lower heating value 3.7 kWh/kg
Thermo-electric power plant efficiency for the local island grid 35 %
η el,RS
Natural gas auxiliary heater in reference system 80 %
η AH,RS
η AH,PS Natural gas auxiliary heater in proposed system 95 %
Electric chiller coefficient of performance 3 –
COP CH,RS
F NG Equivalent CO 2 emissions for coefficient for natural gas 0.20 kgCO 2 /kWh PE
Equivalent CO 2 emissions for coefficient for electric energy 0.48
F el kgCO 2 /kWh e
a Discount rate 5 %
TH Time horizon 20 years
It is clear that, the increase of the electricity demand during the particular, typical winter and summer operation days are investigated
hotter weeks also leads to peak values of electricity withdrawn from the for the proposed systems PS1 and PS2.
grid, E el,fromGRID , as well as a decrease of the electricity delivered to the In a typical summer day (Fig. 8), the outlet temperature of the CPVT
grid, E el,toGRID . Note that purchasing electric energy in layouts coupling collectors in PS1 is equal to 90 °C. The reported oscillating trend is due
PV fields with electric-driven technologies without electric storage to the varying inlet water temperature, depending on the thermal load
systems, is necessary to cover the energy demand during the night of the plant, slightly affecting the CPVT inlet temperature. Fig. 8 also
hours, when the PV electric energy production is null. In addition, the shows the variation of the operation of the CPVTs as a function of the
growing trend of E el,RO+District+Aux during summer is due to the increase solar radiation. When the solar radiation is null, the feedback controller
of the electricity demand of the district because the RO unit demand is of the pump P1 stops the pump. The pump operates only when the
almost constant during the year. A slight increase of energy delivered to radiation is not null and the outlet water temperature from the col-
the RO unit is detected in summer due to the longer days. The elec- lectors is higher than the inlet water temperature, coming from the
tricity consumed by heat pumps for space heating and cooling and bottom part of the TK1 or TK2. The electrical and thermal efficiencies of
DHW of the district, E el,HPheat&cool+DHW., is lower than the produced the CPVT are equal to 20% and to 60%, respectively. The operation of
energy E el,PV from the 9th to the 33rd week, i.e., when the HP for space PS1 in a typical summer day is shown in Fig. 9. The left graph presents
heating and cooling consumption is low and the E el,HPheat&cool+DHW the top TK1 and TK2 temperatures, T topTK1 and T topTK2 , to show the
considers only the electric energy demand of the HP for DHW. implemented control strategy regarding the management of the thermal
Conversely, during the colder winter weeks and the hotter summers storages. The CPVT collectors first supply TK1, matching the cooling
weeks, the E el,HPheat&cool+DHW. is higher than the produced energy E el,PV . and DHW demand. Solar thermal heat is then delivered to TK2, sup-
The weekly specific energy consumption, not shown for sake of brevity, plying heat to the MED unit, only when TK1 is fully charged i.e., when
3
is averagely constant equal to 2.1 kWh/m , lower than the average its top temperature reaches the set-point temperature equal to 86 °C.
3
value suggested in literature, equal to 3.3 kWh/m [13]. The reason for This occurs around midday, when the trends of T topTK1 and T topTK2 show
this difference is that in this layout the pressure exchanger is included. the continuous switching of the CPVT outlet hot water between the two
tanks. In particular, from 09:00 to 13:00, the thermal energy required
5.3. Hourly results by the auxiliary heater, supporting the MED activation, decreases
considerably. This is also due to the trend of the Favignana district
In order to better understand and analyze the operation of the cooling demand, which is negligible during these hours (Fig. 5), in
comparison to the cooling demand during the afternoon hours. In fact,
plants, in terms of temperature, power, and implemented control stra-
tegies, the hourly results of dynamic simulations are also discussed. In from 12:00 to 17:30, all the solar heat is delivered to the TK1, supplying
13