
Page 11 - Water-energy_2020
P. 11
F. Calise, et al. Energy Conversion and Management 220 (2020) 113043
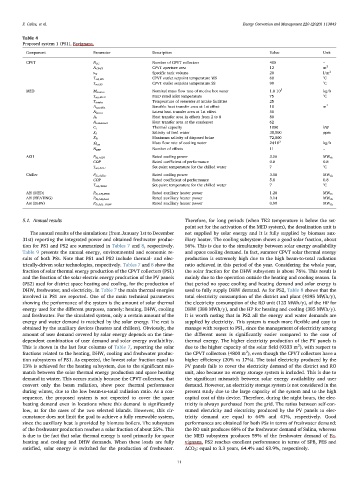
Table 4
Proposed system 1 (PS1), Favignana.
Component Parameter Description Value Unit
CPVT N SC Number of CPVT collectors 400 –
CPVT aperture area 12 m 2
A CPVT
Specific tank volume 20 l/m 2
v tk
CPVT outlet setpoint temperature WS 60 °C
T set,WS
CPVT outlet setpoint temperature SS 90 °C
T set,SS
MED M motive Nominal mass flow rate of motive hot water 1.8 10 5 kg/h
MED rated inlet temperature 75 °C
T set,MED
Temperature of seawater at intake facilities 25
T intake
2
A sensible Sensible heat transfer area at 1st effect 10 m
Latent heat transfer area at 1st effect 50
A latent
A i Heat transfer area in effects from 2 to 8 80
Heat transfer area at the condenser 62
A condenser
C t Thermal capacity 1000 kW
Salinity of feed water 38,000 ppm
X f
Maximum salinity of disposed brine 72,000
X B
3
M ̇ cw Mass flow rate of cooling water 24·10 kg/h
Number of effects 11 –
N EFF
ACH P th,ACH Rated cooling power 3.56 MW th
COP Rated coefficient of performance 0.8 0.8
Set-point temperature for the chilled water 7 °C
T set,ACH
Chiller P th,chiller Rated cooling power 3.56 MW th
COP Rated coefficient of performance 5.8 0.8
Set-point temperature for the chilled water 7 °C
T set,chiller
AH (MED) P th,AH,MED Rated auxiliary heater power 1.20 MW th
AH (HEATING) P th,AH,heat Rated auxiliary heater power 3.14 MW th
AH (DHW) P th,AH, DHW Rated auxiliary heater power 0.90 MW th
5.1. Annual results Therefore, for long periods (when TK2 temperature is below the set-
point set for the activation of the MED system), the desalination unit is
The annual results of the simulations (from January 1st to December not supplied by solar energy and it is fully supplied by biomass aux-
31st) reporting the integrated power and obtained freshwater produc- iliary heater. The cooling subsystem shows a good solar fraction, about
tion for PS1 and PS2 are summarized in Tables 7 and 8, respectively. 56%. This is due to the simultaneity between solar energy availability
Table 9 presents the annual energy, environmental and economic re- and space cooling demand. In fact, summer CPVT solar thermal energy
sults of both PSs. Note that PS1 and PS2 include thermal- and elec- production is extremely high due to the high beam-to-total radiation
trically-driven solar technologies, respectively. Tables 7 and 8 show the ratio achieved in this period of the year. Considering the whole year,
fraction of solar thermal energy production of the CPVT collectors (PS1) the solar fraction for the DHW subsystem is about 76%. This result is
and the fraction of the solar electric energy production of the PV panels mainly due to the operation outside the heating and cooling season. In
(PS2) used for district space heating and cooling, for the production of that period no space cooling and heating demand and solar energy is
DHW, freshwater, and electricity. In Table 7 the main thermal energies used to fully supply DHW demand. As for PS2, Table 8 shows that the
involved in PS1 are reported. One of the main technical parameters total electricity consumption of the district and plant (4395 MWh/y),
showing the performance of the system is the amount of solar thermal the electricity consumption of the RO unit (123 MWh/y), of the HP for
energy used for the different purposes, namely: heating, DHW, cooling DHW (388 MWh/y), and the HP for heating and cooling (385 MWh/y).
and freshwater. For the simulated system, only a certain amount of the It is worth noting that in PS2 all the energy and water demands are
energy and water demand is matched by the solar energy. The rest is supplied by electricity. This system is much more flexible and easy to
obtained by the auxiliary devices (heaters and chillers). Obviously, the manage with respect to PS1, since the management of electricity among
amount of user demand covered by solar energy depends on the time- the different users is significantly easier compared to the case of
dependent combination of user demand and solar energy availability. thermal energy. The higher electricity production of the PV panels is
2
This is shown in the last four columns of Table 7, reporting the solar due to the higher capacity of the solar field (9333 m ), with respect to
2
fractions related to the heating, DHW, cooling and freshwater produc- the CPVT collectors (4800 m ), even though the CPVT collectors have a
tion subsystems of PS1. As expected, the lowest solar fraction equal to higher efficiency (20% vs 17%). The total electricity produced by the
13% is achieved for the heating subsystem, due to the significant mis- PV panels fails to cover the electricity demand of the district and RO
match between the solar thermal energy production and space heating unit, also because no energy storage system is included. This is due to
demand in winter. This occurs mainly because the CPVT collectors, that the significant mismatch between solar energy availability and user
convert only the beam radiation, show poor thermal performance demand. However, an electricity storage system is not considered in the
during winter, due to the low beam-to-total radiation ratio. As a con- present study due to the large capacity of the system and to the high
sequence, the proposed system is not expected to cover the space capital cost of this device. Therefore, during the night hours, the elec-
heating demand even in locations where this demand is significantly tricity is always purchased from the grid. The ratios between self-con-
low, as for the cases of the two selected islands. However, this cir- sumed electricity and electricity produced by the PV panels to elec-
cumstance does not limit the goal to achieve a fully renewable system, tricity demand are equal to 64% and 41%, respectively. Good
since the auxiliary heat is provided by biomass boilers. The subsystem performances are obtained for both PSs in terms of freshwater demand:
of the freshwater production reaches a solar fraction of about 25%. This the RO unit produces 68% of the freshwater demand of Salina, whereas
is due to the fact that solar thermal energy is used primarily for space the MED subsystem produces 59% of the freshwater demand of Fa-
heating and cooling and DHW demands. When these loads are fully vignana. PS2 reaches excellent performance in terms of SPB, PES and
satisfied, solar energy is switched for the production of freshwater. ΔCO 2 : equal to 3.3 years, 64.4% and 63.9%, respectively.
11